
Winning with Sports Betting Data
Unlock Profits with betting tips!
At its core, sports betting data is just any piece of information you can measure to place smarter wagers. It’s what helps you shift betting from a game of pure chance to a game of skill.
Think of it like a chef using raw ingredients. While most fans only see the final score, a sharp bettor looks at everything from player stats and historical trends to real-time market odds to cook up a winning strategy. Making that switch from gut feelings to data-driven decisions is the first real step toward long-term success.
The Foundation of Smart Betting
So many bettors get their start by relying on gut instinct, team loyalty, or a simple win-loss record. And while that can be fun for a while, it’s rarely a path to consistent profit. Real strategic betting starts the moment you stop guessing and start treating each wager like a small investment backed by solid evidence. Sports betting data is that evidence.
This information isn't just about who won their last game. It’s about digging into the why and the how behind every single outcome. Instead of just knowing a team is on a hot streak, data helps you see if they consistently struggle against left-handed pitchers or play poorly on the second night of a back-to-back.
Moving Beyond Basic Statistics
The real magic of sports betting data is in its depth. It lets you peel back layers of information that the average fan completely overlooks. By analyzing the right metrics, you can turn a page of raw numbers into a clear, actionable insight.
This process means looking at a few key categories of information:
- Foundational Data: This is your starting point, the basics like final scores, team records, and league standings.
- Performance Metrics: These are the more advanced stats, like a quarterback's passer rating under pressure or a basketball team's defensive efficiency.
- Market Data: This crucial category covers the betting odds, point spreads, and how those lines move over time. It tells you what the rest of the market thinks is going to happen.
The goal is to find value, to spot situations where the odds offered by a sportsbook don't accurately reflect the true probability of an outcome. Data is the tool that shines a light on these opportunities.
The Growing Importance of Data in a Booming Market
The betting world is exploding, which makes a solid handle on data more critical than ever before. The global sports betting market is on track to grow from around USD 98.77 billion to an estimated USD 235.19 billion by 2033. This massive expansion is being driven by new tech and a worldwide move to digital platforms. You can explore the full analysis on Business Wire to understand these global betting trends.
As the market gets bigger, so does the mountain of available information. Learning how to properly find, interpret, and apply sports betting data is no longer just an advantage; it’s becoming a flat-out necessity for anyone who is serious about winning.
Finding Reliable Sports Data Sources
Think of high-quality sports betting data as premium fuel for your strategy. Your models and decisions are only as good as the information you feed them. Using flawed or outdated data is actually worse than just going with your gut because it gives you a false sense of confidence, leading you to make bad bets you think are smart.
The hunt for good data starts with understanding the two main camps: free sources and paid services. Each has its place, and knowing the difference will save you a ton of headaches, depending on your goals, budget, and how deep you want to go.
Free Versus Paid Data Sources
For anyone just dipping their toes in, free data sources are the obvious starting point. We're talking about official league sites like NFL.com or NBA.com, major sports media outlets, and even historical archives on places like Wikipedia. They're great for grabbing the basics, final scores, team records, and standard player stats.
But free data almost always comes with a catch. The information can be delayed, it's often not very detailed, and it's usually presented in a way that's a nightmare to analyze systematically. For a serious bettor, these limitations are a massive roadblock to finding a real, sustainable edge.
Paid data sources, on the other hand, are built for one purpose: serious analysis. These typically come in the form of a sports data API (Application Programming Interface), which is just a fancy way of saying it’s a direct, clean, and real-time feed of information that plugs right into your software or spreadsheet.
A sports data API is like having a direct pipeline into a provider's database. It delivers instant, structured updates on everything from player injuries and weather reports to live odds movements across dozens of sportsbooks.
These services offer a level of depth, speed, and accuracy you just can't get for free. They're pretty much non-negotiable for anyone running complex models or engaging in real-time strategies like arbitrage or live betting. Yes, they cost money, but the quality of the data can completely change the game.
Comparing Common Sports Data Sources
To make sense of the landscape, it helps to see how these different source types stack up against each other. Each one serves a different kind of bettor, from the casual fan to the professional analyst.
| Data Source Type | Typical Cost | Data Quality | Update Frequency | Best For |
|---|---|---|---|---|
| Official League Sites | Free | High (for official stats) | Delayed (post-game) | Beginners needing basic historical data. |
| Sports Media Outlets | Free | Variable (good for news, basic stats) | Real-time for news, delayed for data | Casual bettors following news and simple stats. |
| Data Scraping (DIY) | Low (time/tools) | Depends on skill; can be inconsistent | Manual or scheduled | Tech-savvy bettors needing custom, niche datasets. |
| Sports Data APIs | Paid (Subscription) | Very high (clean, structured, accurate) | Real-time (instant updates) | Serious bettors, quants, and developers. |
| Odds Comparison Sites | Free to Freemium | High (for odds data) | Real-time | Value bettors looking for market inefficiencies. |
This table gives you a clear picture of the trade-offs. While free sources are a great starting point for foundational knowledge, serious bettors almost always graduate to paid APIs to get the speed and accuracy needed to compete.
Key Qualities of a Reliable Data Provider
When you're shopping around for a data source, a few non-negotiable factors should be at the top of your list. A provider might be cheap, but if it fails on these core principles, it’s not worth your time or money.
- Accuracy: The data has to be right. Period. A single wrong score or an incorrect player status can send your entire analysis off a cliff.
- Timeliness: In betting, speed is everything. Information on live odds, injuries, or lineup changes is most valuable the second it becomes public. A delay of just a few minutes can make a profitable opportunity vanish.
- Completeness: A good source gives you the full picture. Does it have historical data going back 5-10 seasons? Does it cover advanced metrics or just the basics? The more complete the dataset, the smarter your models can be.
- Accessibility: The data needs to be easy to get and work with. This is where APIs are king, offering structured formats like JSON or CSV that are ready for analysis right out of the box. This saves you hundreds of hours of mind-numbing manual data entry.
A Note on Data Scraping
Some bettors try to build their own datasets through data scraping, which means using automated bots to pull information directly off websites. While it sounds like a clever way to get custom data for free, it lives in a legal and ethical gray area.
Most websites explicitly forbid scraping in their terms of service. Get caught, and you could be blocked or even face legal trouble. If you're even thinking about this route, you have to do your homework, understand the rules, and respect website policies to stay on the right side of the line.
The Essential Data Types Bettors Use
To consistently find an edge, you have to look past simple win-loss records and really dig into the specific types of sports betting data that power winning models. This isn't about staring at a random collection of numbers; it's about understanding how different layers of information fit together. By breaking a game down into its core data components, you start to see it in a whole new way.

It’s a process of peeling back the layers, moving from the obvious, surface-level stuff to the specific metrics that actually predict performance. Each layer gives you a clearer picture of what’s really happening on the field or court. Getting a handle on these distinct categories is the first real step toward building a truly analytical betting approach.
Foundational Data: The Starting Point
Foundational data is exactly what it sounds like, the basic building blocks of any sports analysis. This is the stuff you’ll find on any major sports website or TV broadcast. It’s easy to get, simple to understand, and gives you the essential who, what, and where for any matchup.
This category covers the most straightforward stats:
- Final Scores and Game Outcomes: The bottom line of who won, who lost, and by how much.
- Team and Player Records: A team's overall season performance (like 10-2) or a player's individual stats.
- League Standings: A simple ranking of where a team sits in its division or conference.
But here’s the thing: relying on this data alone is a huge mistake. A team with a great record might be awful on the road or when playing on short rest. Foundational data tells you what happened, but it rarely explains why.
Advanced Performance Metrics
This is where sharp bettors start to pull away from the crowd. Advanced performance metrics, often called analytics or sabermetrics, go much deeper to measure efficiency and situational performance. They adjust for context and reveal the underlying strengths or weaknesses that basic stats completely miss.
Think of it like this: a basketball player's points per game is a foundational stat. But their Player Efficiency Rating (PER), which weighs positive and negative contributions on a per-minute basis, is an advanced metric. It gives you a much more honest picture of their actual impact on the game.
In football, a team's total rushing yards is a basic stat. A far more insightful metric is yards per carry against stacked boxes. This tells you how well their running game holds up when the defense knows it's coming. That’s the kind of data that reveals real strategic strength.
Key Takeaway: Advanced metrics provide the "why" behind the "what." They help you spot a team that is better, or worse, than their simple record suggests. That's where you'll almost always find the real betting value.
Critical Market Data
The final piece of the puzzle has nothing to do with the teams or players at all, it's about the betting market itself. Market data tells you what other bettors and the sportsbooks think is going to happen. Analyzing this information is crucial for understanding where the money is going and finding lines that might be mispriced.
Key types of market data include:
- Live Odds Movements: Tracking how odds and point spreads shift from the moment they open until game time. A big line move can signal a key injury, a weather change, or a massive amount of sharp money hitting one side.
- Public Betting Percentages: This shows what percentage of the public is betting on each side of a game. Fading the public, betting against the popular side, can be a profitable long-term strategy in the right spots.
The odds listed for spread, moneyline, and total bets are all direct reflections of how the market is pricing a game's potential outcomes.
The global appetite for these betting markets is massive. Europe currently accounts for the largest regional share, generating about 48% of total worldwide revenue. The entire market is projected to hit USD 187.39 billion by 2030, with live, in-play betting growing the fastest. You can discover more insights about the global sports betting market to see just how big this is getting. This explosive growth just proves how vital it is to analyze real-time market data to stay ahead of the curve.
How to Analyze Data for Betting Insights
Collecting a mountain of sports betting data is one thing, but the real magic happens when you turn those raw numbers into an actual betting edge. This is where analysis comes in. It’s less about being a math genius and more about learning to ask the right questions to make the stats talk.
The journey starts with simple but powerful techniques anyone can get the hang of. By learning to spot real patterns, accept the role of pure luck, and notice when something is way out of the ordinary, you start seeing games in a way most bettors, and sometimes even the sportsbooks, completely miss. It’s like learning a secret language hidden in the box score.
Identifying Meaningful Trends
The first skill to master is telling the difference between a real trend and just random noise. A team winning three games in a row is a streak. A team consistently covering the spread as a road underdog? That’s a trend. The key difference is that a trend has predictive power because it points to a real, underlying strength or weakness.
To find these gold nuggets, you have to look for consistency over a decent sample size. Don't get fooled by a team's last couple of games. Instead, zoom out and analyze how they perform in specific situations over an entire season or even multiple seasons.
Here are a few examples of meaningful trends worth hunting for:
- Performance on Short Rest: How does an NBA team really play on the second night of a back-to-back? A lot of teams see their defensive effort fall off a cliff.
- Home vs. Road Splits: Some teams are completely different animals away from home. This goes way beyond their win-loss record and often shows up in their ability to cover the spread.
- Situational Player Performance: Does a star quarterback's completion percentage tank in cold weather? Does a basketball team's three-point shooting dry up when they face a top-tier defense?
Understanding Variance and Outliers
Variance is a concept you absolutely have to wrap your head around in betting. It’s the natural, unpredictable swing of luck that happens in every sport. That last-second, tipped-ball touchdown that covers the spread is pure variance; it doesn't mean your analysis was junk.
Getting comfortable with variance helps you stay disciplined. It’s a constant reminder that even a perfect strategy will hit losing streaks. The key is to trust your process and not freak out over a few unlucky bounces. A huge part of working with sports betting data is knowing you're in it for the long haul.
The goal of data analysis isn't to predict every game with 100% accuracy, that's impossible. The real goal is to consistently find bets where the odds offered are better than the true probability of that outcome.
Spotting statistical outliers is another powerful move. An outlier is just a data point that is wildly different from the norm. For example, if a baseball team that averages 4.5 runs per game suddenly explodes for 15 runs, that's an outlier. Your job is to figure out if it was a random fluke or if something fundamental changed, like a star player finally returning from injury.
Introduction to Predictive Modeling
Once you’re comfortable spotting trends and dealing with variance, you can step up to a more structured approach. This is where predictive modeling comes in, and it's not nearly as scary as it sounds. At its core, a predictive model is just a system you build to create your own projection for a game.
Think of it as building your own point spread. You take different stats you think are important, give them a certain weight, and spit out a final score projection. Then, you just compare your number to the sportsbook's line to find gaps. If your model says a team should win by 10 points and the spread is only -6, you’ve just found a potential value bet.
For a much deeper look into how these models are built, our guide on sports betting analytics breaks down the whole process of turning data into profit.
Using Regression Analysis to Find Hidden Connections
To give your models even more firepower, you can use techniques like regression analysis. This is just a statistical method for finding the relationship between different variables. It helps you answer questions like, "How much does a quarterback's completion percentage actually affect his team's chances of covering the spread?"
For instance, you might run a regression analysis on NFL data and find that for every 1% increase in a QB's completion percentage, his team's chance of covering the spread goes up by 0.5%. This isn't a gut feeling; it's a measurable relationship you can build right into your betting model.
By uncovering these hidden connections, you move beyond simple trend-spotting and into a much more sophisticated level of analysis. This is where you can build a truly unique edge that separates you from the rest of the betting public.
Turning Your Analysis into Winning Strategies
Raw analysis is a powerful thing, but it's pure potential until you connect it to a real-world betting strategy. This is the crucial step where you translate all those hard-won insights into actual wagers with a positive expected value. Just knowing a team is underrated isn't enough; you need a framework to actually capitalize on that knowledge.
The whole goal is to move from theory to practice. Once your number-crunching flags a potential opportunity, the next move is to apply a proven strategy that gives you an edge. Two of the most effective, data-driven approaches are value betting and arbitrage betting.
The Core Strategy of Value Betting
Value betting is the absolute cornerstone of professional sports wagering. The concept is refreshingly simple: you only place a bet when you believe the probability of an outcome is greater than the probability implied by the sportsbook's odds.
Think of it like finding an item on sale for $20 when you know it’s truly worth $30. You'd snap it up in a heartbeat.
The process kicks off with your own data analysis. Using the methods we've already covered, you create your own projection for a game. This gives you your own "true" probability for a team winning or covering the spread.
Next, you convert the sportsbook's odds into an implied probability. For example, odds of +150 imply a probability of 40%. If your analysis shows the team actually has a 45% chance of winning, you’ve just found a value bet. The market has underestimated their true chances, creating a profitable opportunity for you.
The essence of value betting is a disagreement between your data-driven assessment and the market's pricing. You are betting that your analysis is more accurate than the odds on offer.
Turning your analysis from a collection of trends into a functional betting model is a skill in itself. For anyone looking to dive deeper, our detailed guide explains how to build a sports betting model from the ground up.
The infographic below shows the basic workflow for turning raw sports data into a tangible edge.
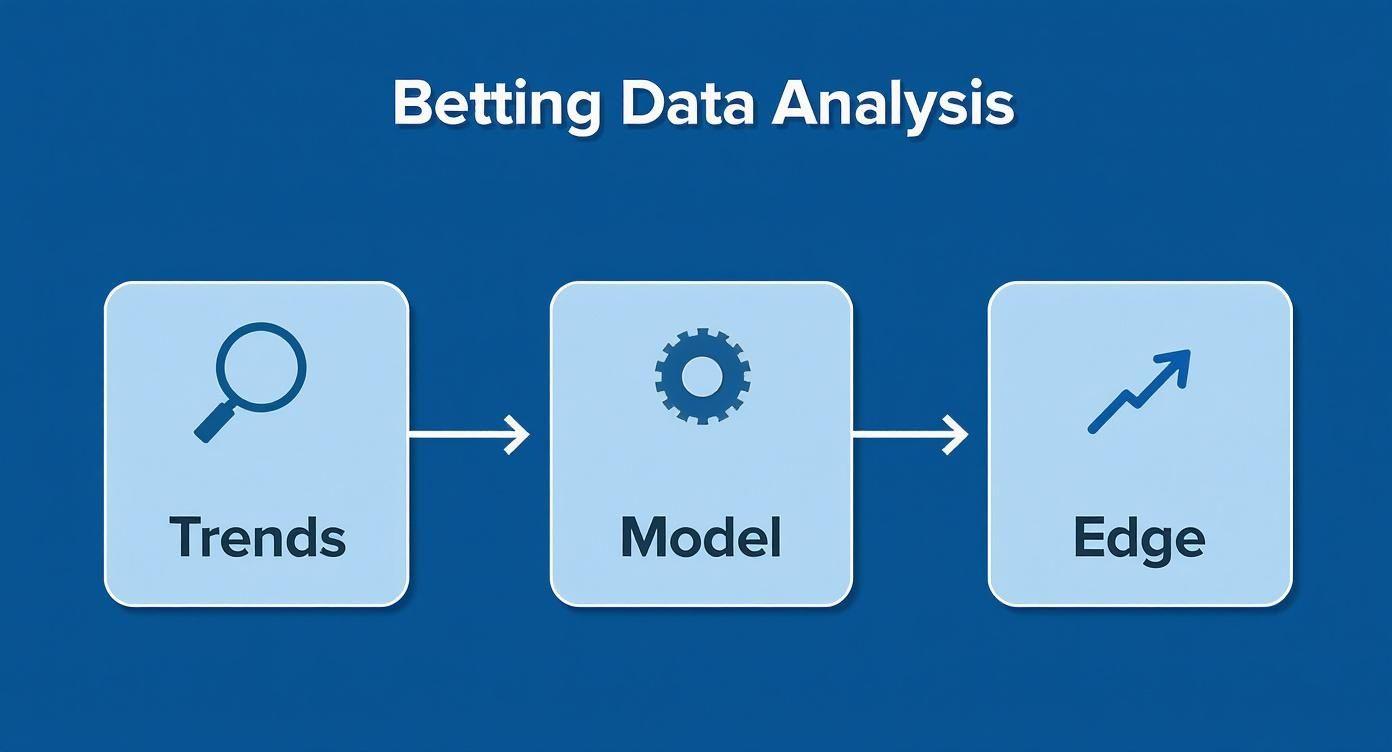
This visualizes how bettors identify trends, build them into a predictive model, and use that output to find a statistical edge against the bookmakers.
Exploring Arbitrage Betting Opportunities
Another powerful strategy fueled by real-time sports betting data is arbitrage betting, often called "arbing." This method involves placing wagers on all possible outcomes of an event across different sportsbooks to guarantee a small, risk-free profit, no matter who wins.
This is only possible because different bookies sometimes offer slightly different odds on the same game. An arbitrage opportunity exists when the implied probabilities from the odds on all outcomes add up to less than 100%.
For example, Sportsbook A might offer odds of +110 on Team A, while Sportsbook B offers +110 on Team B in the same game. By betting the right amount on both sides, you lock in a profit no matter what. These opportunities are rare and can disappear in seconds, which makes real-time data feeds and pure speed absolutely essential for success.
Case Study Finding a Value Bet in Action
Let's walk through a practical example. Imagine the Los Angeles Lakers are playing the Boston Celtics. The market has the Celtics as -150 favorites, which implies a 60% win probability. Most of the public money is on the Celtics because of their recent winning streak.
But your analysis reveals a few key insights:
- The Lakers perform exceptionally well on the road after two days of rest, covering the spread in 70% of those situations.
- The Celtics' star player has a noticeable drop in shooting percentage when facing the Lakers' top defender.
- Your predictive model, factoring in these variables, projects the Lakers have a 45% chance to win, not the 40% implied by their +150 odds.
This 5% gap between your projected probability (45%) and the implied probability (40%) is your value. You place a wager on the Lakers, confident that your deeper data analysis has uncovered an edge the general market has overlooked. This isn't a small-time game; the Asia-Pacific region alone represents roughly 47% of all sports wagers. You can read the full research on the global sports betting market to grasp its massive scope.
Tools That Make Data Analysis Easier
You don't need to be a data scientist holed up in a lab to get a real edge from sports betting data. Far from it. Modern tools and platforms are built to do all the heavy lifting, turning a chaotic sea of raw numbers into clear, actionable signals you can actually use. These tools automate the soul-crushing work of data collection and processing, letting you focus on strategy and decision-making.
This means you can jump straight to finding valuable betting opportunities without spending hours manually scraping stats from a dozen different websites. The right software can instantly flag market inefficiencies that would otherwise take days of painstaking work to uncover.
Key Software for Smart Betting
The software landscape for serious bettors really boils down to a few essential categories. Each one serves a specific purpose, from finding the best price on a bet to running sophisticated analysis that spots value for you.
- Odds Comparison Tools: These are your absolute starting point. Think of them as a price-checker for bets. They scan dozens of sportsbooks in real-time to show you which one is offering the best line for the bet you want to make, ensuring you get maximum value on every single wager.
- Betting Analytics Platforms: These are the more powerful, all-in-one solutions. They provide deep historical data, predictive modeling tools, and often identify value bets for you automatically, turning complex analysis into a simple alert on your screen.
- Data Feeds and APIs: For the most advanced bettors building their own models, these services provide a direct pipeline of real-time sports data. This is the raw material used to power custom-built betting models and fully automated strategies.
This screenshot from the ValueBetFactory platform shows how essential information like the odds, the value percentage, and the specific bookmakers can be organized for quick, sharp decision-making.

You can see how the interface clearly highlights value bets by presenting the sportsbook's odds right alongside the calculated "true" odds, making it dead simple to spot a profitable discrepancy.
What to Look for in a Betting Tool
Not all platforms are created equal, not by a long shot. When you’re choosing a tool to help your betting, you need to focus on features that directly impact your ability to make smarter, faster decisions. A clean interface and rock-solid performance are completely non-negotiable.
The best tools don't just dump data on you; they present it in a way that helps you make a decision. They filter out all the noise and highlight the handful of opportunities that actually matter.
Keep an eye out for these key features:
- Speed of Updates: The betting market moves at lightning speed. A tool that provides real-time odds and data updates is critical, as a juicy line can disappear in minutes, or even seconds.
- Depth of Data: Check how far back the historical data goes. The more quality data a platform has crunched, the more reliable and trustworthy its analysis and predictions are going to be.
- User Interface (UI): A cluttered or confusing interface is a deal-breaker because it makes it hard to act quickly. The best platforms present complex information in a simple, intuitive way that helps you find what you need without any friction.
- Customization: The ability to filter by sport, league, or even specific bet types allows you to zero in only on the opportunities that fit your personal strategy.
By picking a tool that really nails these areas, you can seriously upgrade your workflow. To learn more about how technology can sharpen your process, check out our guide on how to automate data analysis to save time and boost your accuracy.
A Few Final Questions About Sports Betting Data
Diving into the world of sports betting data can feel a bit overwhelming, and it’s natural for a few questions to pop up along the way. To wrap things up, let's tackle some of the most common queries bettors have when they first start out.
Think of this as a quick-reference guide to help clear up any lingering confusion and get you on the right track.
How Much Data Do I Really Need to Get Started?
You don't need to build a massive, all-encompassing database from day one. In fact, that's one of the biggest mistakes beginners make. The key is to start small and focused.
Pick a single sport or even just one league you know well. Begin by collecting the basics: final scores, closing point spreads, and fundamental team stats for the current season. Once you get comfortable working with that, you can slowly start adding more layers, like advanced performance metrics.
It's all about quality over quantity. A clean, well-organized dataset for one full season is infinitely more powerful than a messy, decade-spanning pile of stats you can't make sense of. Nail the consistency first, then build from there.
The best approach is to start small and let the complexity grow with your confidence. Master the analysis of just one or two key data points before you even think about adding more variables. It's the only way to avoid getting lost in the noise.
Is Real-Time Data a Must-Have for Every Bettor?
Absolutely not. Whether you need real-time data comes down to one thing: your strategy.
- Pre-game bettors, the majority of people, can do just fine with data that's updated once a day. Your analysis is happening hours, or even days, before the first whistle, so end-of-day stats are more than enough to find an edge.
- Live or in-play bettors, on the other hand, live and die by real-time data. Their entire strategy is built on reacting to what's happening on the field right now, making that split-second information non-negotiable.
- Arbitrage bettors also fall into this camp. They need instant data feeds to spot and pounce on those fleeting price differences between sportsbooks before they disappear.
For most bettors who are analyzing games before they start, a reliable daily data feed is all you need to find a consistent, profitable edge.
Can I Actually Trust Free Data Sources?
Free data sources are a fantastic starting point for learning the ropes and grabbing basic historical stats. But when you get serious about betting, you'll quickly run into their limitations.
Things like data delays, a lack of real depth, and wildly inconsistent formatting are common problems. While you can certainly trust an official league website for an accurate final score, a paid data API is what gives you the speed, detail, and reliability needed for more advanced, profitable strategies.
Ready to stop guessing and start making sharp, data-driven decisions? At ValueBetFactory, we give you the tools to find profitable betting opportunities without all the manual grunt work. Explore our platform today and start building your edge.