
How to Build a Sports Betting Model That Wins - Proven Tips
Unlock Profits with betting tips!

Let’s be honest: winning at sports betting isn't about hunches or "gut feelings." If you want to be profitable long-term, you have to trade those vague instincts for a data-backed edge. This is where building your own sports betting model comes in. It’s all about creating a system that can find value the public—and sometimes even the sportsbooks—completely misses.
This guide will walk you through exactly how to do that, moving from the initial idea to a fully functional model that can actually make you money.
Think about the sheer scale of the market. In the United States alone, the total amount wagered soared to $142.55 billion, a massive jump since the 2018 PASPA repeal. With so much money flowing, the game is getting sharper. Having a statistically sound model isn't just an advantage anymore; it’s becoming a necessity. You can dive deeper into this growth in recent sports business analysis.
The Blueprint for a Successful Model
So, what does it take to build one? A winning model isn't some mystical black box. It's a logical system built on a few core pillars. Getting these right is the first step to creating a real, measurable advantage.
Let's break down the essential components you'll need to piece together.
Core Components of a Winning Betting Model
| Component | What It Means | Why It Matters |
|---|---|---|
| A Specific, Measurable Goal | Instead of just "winning more," you define a narrow focus. Think NBA player points over/unders or moneyline bets for home underdogs in the Premier League. | A clear goal prevents you from getting lost in the noise. It helps you source the right data and choose the right analytical approach for a specific problem. |
| Clean, Reliable Data | This is the fuel for your model. It includes historical game scores, player stats, team metrics, and crucially, opening and closing betting lines. | Garbage in, garbage out. Your model's predictions are only as good as the data you feed it. Without clean data, your results will be meaningless. |
| A Suitable Modeling Technique | This is the engine of your system. It could be a simple regression analysis in a spreadsheet or a more complex machine learning algorithm like a random forest. | The technique must match your data and your goal. A simple model that works is far better than a complex one you can't manage or interpret. |
Getting these three pieces right lays the foundation for everything else.
Expert Insight: Remember, the goal isn't to perfectly predict the outcome of every single game. That's impossible. The real objective is to build a system that consistently finds and flags discrepancies between your calculated odds and the sportsbook's odds. That's where you find value.
By focusing on this framework, you transform betting from a pure gamble into a calculated investment. Every wager you place will be backed by a clear, logical reason rooted in statistical probability.
Building Your Data and Strategy Blueprint
Every successful betting model I've ever built started not with a bunch of complex code, but with a single, sharp question. If your goal is something vague like "I want to win more bets," you're setting yourself up for a world of frustration. Real progress happens when you get specific and carve out a manageable niche.
Instead of trying to take on the entire sports betting universe, pick one specific battleground and own it. You might decide to focus only on NBA player props—specifically points, rebounds, and assists. Or maybe you see an edge in predicting total goals (over/under) in Europe's top soccer leagues. That kind of focus is your biggest advantage.
Define Your Niche
Getting clear on a narrow goal is the bedrock of maximizing your expected value. It forces you to think hard about which sports, leagues, and bet types are truly worth your time. The more specific you are, the easier it is to find the right data and build a system that actually works. If you're wondering how to frame these initial questions, our guide to building a sports betting model breaks down how to create a solid framework.
My Two Cents: Don't ever underestimate the power of starting small. A model that consistently finds value in one market—like NFL quarterback passing yards—is infinitely more valuable than a huge, messy model that tries to do everything and accomplishes nothing.
Once you’ve locked in your niche, it’s time to gather your raw materials: the data.
Sourcing Reliable Sports Data
Let's be clear: your model is only as good as the data you feed it. Think of it like fuel for an engine. If you put cheap, dirty fuel in a high-performance engine, you're going to get poor results. It’s that simple. You need deep, historical data covering everything relevant to your chosen market.
What does that look like in practice? You’ll need a mix of data points, including:
- Game-level stats: Final scores, of course, but also team stats like possession, shots on goal, and where the game was played.
- Player-level stats: Points, minutes played, and any other performance metric that matters for your chosen bet type.
- Betting market data: This is a big one. You absolutely need historical opening and closing odds from multiple sportsbooks. This data shows you how the market thinks and is critical for spotting value.
You’ll find both free and paid data sources out there. While paid services are convenient and give you clean, API-ready data, free resources can be just as powerful if you don't mind getting your hands dirty.
For example, a site like Sports-Reference is an absolute goldmine, offering tons of free historical data for almost any sport imaginable.

This is the kind of stuff that forms the backbone of a solid predictive model.
Structuring Your Data for Analysis
Raw data is almost always a mess. You’ll find missing values, weird formatting, and other errors that will absolutely sabotage your analysis if you don't fix them. Data cleaning isn’t just a suggestion; it’s a non-negotiable step before you write a single line of model code.
The goal here is to get everything into a clean, structured format, like a CSV file or a database table. A good rule of thumb is to have each row represent a single event (like one game) and each column represent a specific feature (like the home team's score or the closing betting line).
Here’s a simplified look at what this might look like for a few NBA games:
| Game_ID | Date | Home_Team | Away_Team | Home_Score | Away_Score | Closing_Line |
|---|---|---|---|---|---|---|
| 202301 | 2023-10-25 | Lakers | Nuggets | 107 | 119 | -5.5 |
| 202302 | 2023-10-25 | Warriors | Suns | 104 | 108 | -1.5 |
This kind of clean, organized table is what allows software like Excel, Python, or R to start its work finding patterns. Putting in the effort here saves you from massive headaches down the road and builds your model on a foundation of reliable, accurate information. Trust me, it’s a discipline that separates the pros from the amateurs.
Choosing the Right Modeling Technique for Your Goal
Alright, your data is clean and organized. You've laid the groundwork. Now comes the fun part: picking the right engine to power your predictions. This is where many people get intimidated, especially if they don't have a data science background, but it doesn't have to be that way. The secret is simply matching the tool to your goal and what you're comfortable with.
You don't need a supercomputer to get started. Honestly, some of the most profitable models I've seen are built on surprisingly simple logic. The goal isn't to find the most complex algorithm imaginable, but the one that actually solves your specific problem.
Starting with Simple and Effective Methods
For many betting markets, a basic regression analysis can be incredibly effective. Let's say you're trying to predict the total points in an NFL game. You could use a linear regression model—something you can even do in a program as common as Excel—to see how things like a team's average points per game and their opponent's defensive stats line up with the final score.
This approach gives you a tangible way to measure relationships in your data. For example, your model might spit out a finding like, "for every 3-point increase in a team's offensive rating, the game total tends to go up by 1.5 points." It’s a direct, easy-to-understand method for making data-driven picks without getting lost in a sea of complex code.
This next image really drives home the process of getting your data ready for these kinds of techniques.
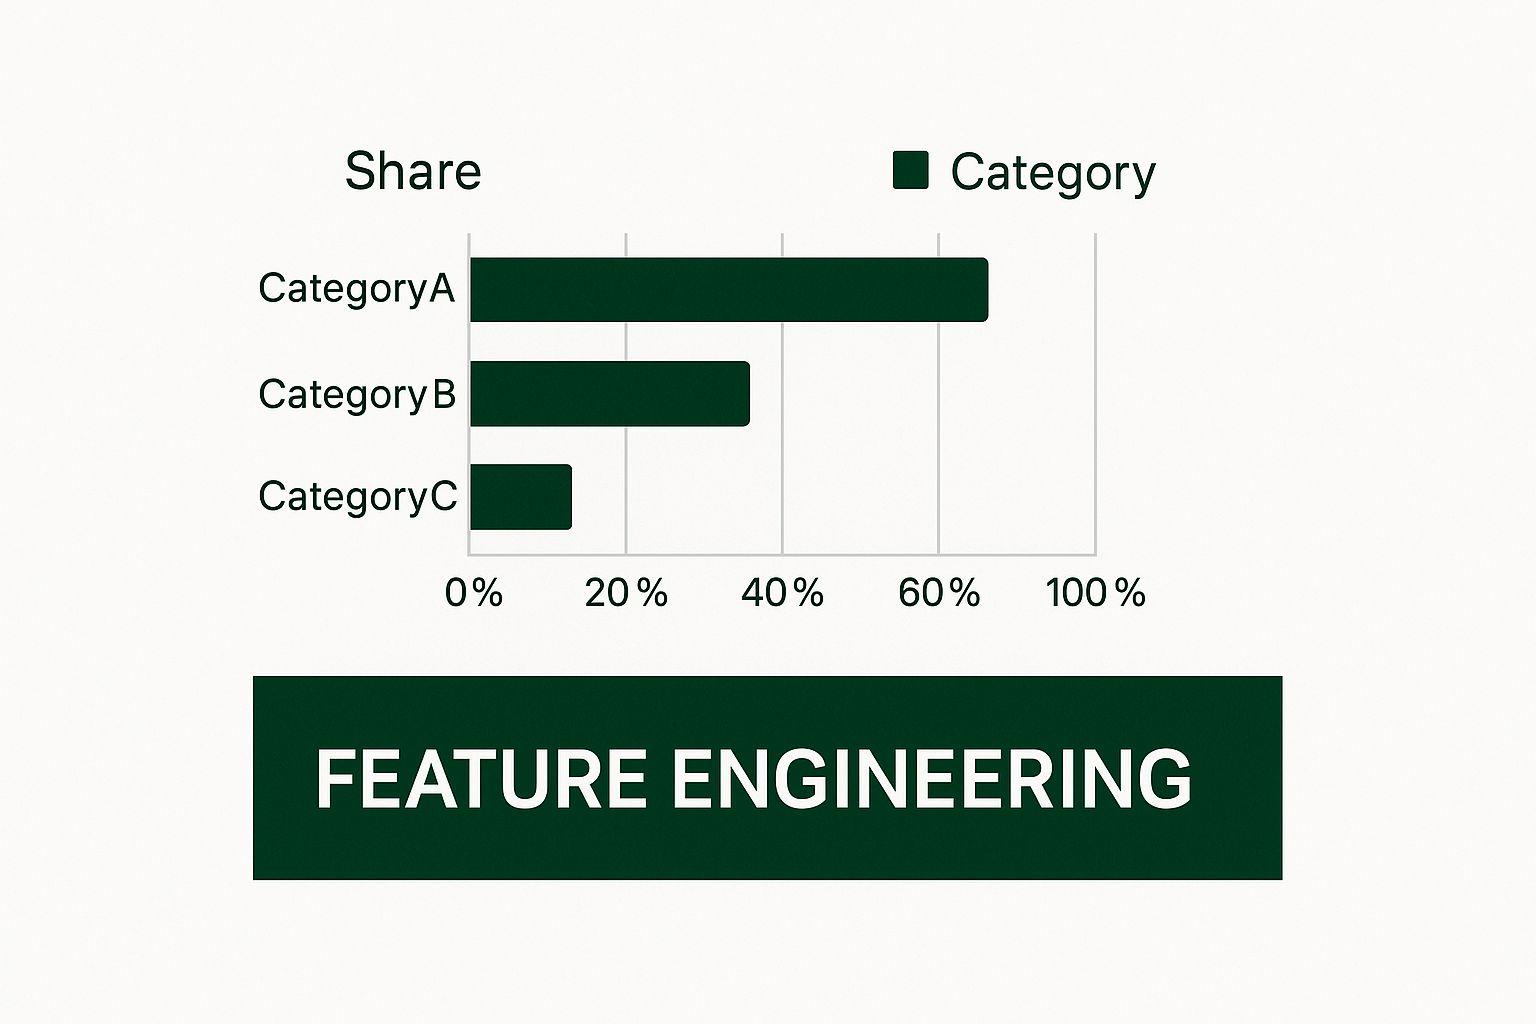
What you're seeing here is the essence of feature engineering—turning raw stats into meaningful predictors that your model can actually use.
Stepping Up to Machine Learning Algorithms
When you feel you've hit the ceiling with simpler methods, or you want to tackle more complex questions, machine learning offers a whole new toolbox. These models are brilliant at finding subtle patterns that simpler approaches might overlook, especially when you're juggling a ton of different variables.
A few popular choices in the sports betting world include:
- Logistic Regression: This should be your go-to for any "yes or no" question. Instead of predicting a number (like total points), it predicts a probability. For example, what's the likelihood of Team A winning? If your model calculates a 60% chance of winning, but the sportsbook's odds only imply a 50% chance, you've just spotted potential value.
- Random Forests: I like to think of this one as a committee of experts. A random forest builds hundreds of individual "decision trees" and then polls them for a final answer. This group approach makes it fantastic at handling tricky interactions between variables, like how a star quarterback's absence affects the point spread differently when facing a top-tier defense versus a weaker one.
My Two Cents: The model you choose boils down to the question you're asking. Predicting a number like points or yards? Use a regression model. Predicting a win/loss outcome? Go with logistic regression. Using the right tool for the job saves a ton of headaches.
Picking the right analytical approach is becoming more important than ever. The sports betting market is absolutely booming, with some analysts projecting it could hit USD 187.39 billion by 2030. This growth is driven by online platforms and, you guessed it, a flood of bettors using analytics to find an edge. As more people wise up, a solid model is what will keep you ahead of the curve. You can read more about the trends driving the sports betting market and see just how big a role analytics is playing.
To help you decide which path to take, it’s useful to see these methods side-by-side.
Comparison of Modeling Techniques for Sports Betting
This table breaks down some common modeling approaches by how complex they are and where they shine.
| Technique | Complexity | Best For | Example Use Case |
|---|---|---|---|
| Linear Regression | Low | Predicting continuous values (e.g., points, yards). Great for beginners. | Predicting the total points in an NBA game based on team offensive ratings. |
| Logistic Regression | Low-Medium | Predicting binary outcomes (e.g., win/loss, cover/no cover). | Calculating the probability that a soccer team will win a match. |
| Random Forest | Medium-High | Complex predictions with many variables and non-linear relationships. | Predicting an NFL point spread winner, factoring in weather, injuries, and historical rivalries. |
| Gradient Boosting | High | High-accuracy predictions where subtle patterns are key. Requires more data. | Identifying undervalued player props by analyzing hundreds of performance stats. |
The right choice really depends on your data and the specific betting market you're targeting.
Let’s make this even more practical. Imagine you're trying to beat the NFL point spread.
A linear regression model is a perfectly fine place to start. You could feed it historical team stats (yards per play, turnover margin) and betting line data to get a baseline prediction for the final score margin. It's solid, and it works.
But a Random Forest could give you a sharper edge. It might pick up on things a linear model would miss, like the fact that a strong running game becomes exponentially more important in freezing temperatures—an interaction that isn't always linear or obvious.
Ultimately, building a sports betting model is a process of trial and error. Start simple, test your results religiously, and only add complexity when you can prove it's actually making your predictions better.
How to Backtest and Validate Your Model Without Lying to Yourself
So, you've built your model. Right now, it's just an interesting idea—a collection of code and data that you hope can find an edge. This next step, backtesting, is where the rubber meets the road. It's the brutally honest process of simulating how your model would have actually performed in the past. This is how we separate a genuinely profitable strategy from one that just looked good on paper.
The entire point here is to answer one critical question: If you had used this model to place bets over the last season or two, what would your bankroll look like? This simulation is your single best defense against wishful thinking and your most reliable preview of what to expect.
Avoiding the Cardinal Sin of Look-Ahead Bias
The single biggest, and most common, mistake in backtesting is look-ahead bias. It’s an easy trap to fall into. This happens when your model uses information that wouldn't have actually been available at the moment a historical bet would have been placed.
Think of it like this: you're trying to predict a game in Week 3, but your model is using the team's final, end-of-season offensive rating. Of course it will look brilliant! It’s like giving someone tomorrow's newspaper to predict yesterday's stock market. In reality, in Week 3, you only knew the team's performance up to that point.
To prevent this, you have to be meticulous. Your model can only "see" data that was public knowledge before kickoff for any given game. No exceptions.
Crucial Takeaway: The only way to do this right is to split your data chronologically. Train your model on an older set of data (say, the 2021-2022 seasons), and then test its performance on a completely separate, "unseen" dataset (like the 2023 season). This mimics how you'll actually be using it.
Defining Your Key Performance Metrics
Once your backtest is running, how do you know if it's any good? A simple win-loss record is dangerously misleading. I've seen models that win 60% of their bets but hemorrhage money because they only ever find value on heavy underdogs or terrible odds. You need to track metrics that reflect actual profitability.
These are the non-negotiables:
- Profit/Loss (P/L): The bottom line. How much money, measured in units (your standard bet size), did the model win or lose?
- Return on Investment (ROI): This is your total profit divided by your total stake. An ROI of 5% is a solid benchmark—it means for every $100 wagered, your average return was $105. It's the ultimate measure of efficiency.
- Number of Bets: How often does your model find an opportunity? A 10% ROI is fantastic, but not if it only found three bets all season. You need a sustainable balance between quality and quantity.
Getting a firm grip on these numbers gives you a true picture of your model's health. For anyone looking to go deeper into the numbers that drive successful wagering, our guide on sports betting analytics is the perfect next step.
The Danger of Overfitting
The other major pitfall that can kill a promising model is overfitting. This is what happens when your model learns the historical data too perfectly. It starts memorizing the noise and random flukes in your training data instead of learning the genuine, underlying patterns.
Imagine your model identifies a pattern that "Team X always wins at home in October after a bye week." That might have been true for a two-year stretch, but it's almost certainly a random coincidence, not a predictive signal. An overfit model will produce amazing backtest results but will get shredded the second it encounters new games in the real world.
The best defense against overfitting is simplicity. Resist the temptation to throw dozens of obscure features into the mix. Every variable you add must prove its worth on your unseen test data. The most robust, long-term profitable models are often the most elegant ones—they capture a true market inefficiency without getting lost in the noise.
Putting Your Model to Work: Finding Real-Time Betting Value

Alright, you've done the heavy lifting. The data has been wrangled, the model has been backtested, and now it's time for the exciting part—unleashing it on the live market. This is where theory becomes reality, and your hard work starts paying off by finding actual, informed wagers. A validated model just sitting on your hard drive isn't making you any money. The real goal is to build an operational system that can spot opportunities as they pop up.
This means creating an automated pipeline to feed your model fresh data. You’ll need to pull daily game schedules, injury updates, and, most crucially, real-time odds from multiple sportsbooks. This can be done by tapping into public APIs that many data providers offer, or if you're comfortable with it, by building your own web scrapers to pull odds directly from bookmaker websites.
Turning Predictions into Your Own Private Odds Line
The heart of your live system is its ability to take your model's raw output and turn it into something actionable. For instance, your model might spit out a prediction that the Los Angeles Lakers have a 62% probability of winning against the Boston Celtics. That percentage is your secret weapon, but it's not a bet just yet.
First, you need to convert that probability into your own "fair" odds. This is the betting line where, according to your model, neither you nor the sportsbook holds an edge.
It’s pretty simple to convert a probability into American odds:
- If probability > 50%: Odds = - (Probability / (1 - Probability)) * 100
- If probability < 50%: Odds = ((1 - Probability) / Probability) * 100
Using our Lakers example, that 62% win probability translates to fair odds of -163. Think of this as your personal truth line. The value comes from hunting down market prices that are better than this number.
Key Takeaway: Your model isn't just a crystal ball for picking winners; it's a tool for spotting pricing mistakes. The whole game is about finding the biggest gap between your calculated "fair" odds and the odds a sportsbook is offering. That gap is your profit.
So, if a sportsbook is offering the Lakers at -140, your model is screaming that there's a significant edge. You're getting a much better price than what your data suggests is fair. This is the very definition of a positive expected value (+EV) bet.
Confirming Your Edge with Expected Value
Spotting a price difference is great, but quantifying that edge is even better. We do this by calculating the Expected Value (EV), which tells you, on average, how much you stand to win or lose if you placed the same bet over and over again.
The formula for positive EV is straightforward:
(Your Win Probability * Decimal Odds) - 1 > 0
Let's stick with our Lakers game. The bookie is offering -140, which is 1.71 in decimal odds. Your model has assigned a 62% (or 0.62) chance of winning.
Plugging this into the formula:
(0.62 * 1.71) - 1 = 1.06 - 1 = +0.06
What this means is that for every $100 you bet, your expected average return is $6. This isn't a guess; it's a clear, mathematical reason to place the wager. The entire foundation of a profitable sports betting model is built on consistently finding and betting on these +EV opportunities.
Smart Staking and Meticulous Tracking
Finding value is only half the equation. If you bet too aggressively, even a brilliant model can send you to the poorhouse during a bad run. This is where bankroll management is absolutely critical. A disciplined staking plan is non-negotiable for surviving the inevitable downswings.
A popular and sound approach is a simplified version of the Kelly Criterion. This strategy advises sizing your bet based on the size of your edge. While the full formula can be a bit much, a simple and effective rule of thumb is to risk a small, fixed percentage of your total bankroll, like 1-2%, on every +EV opportunity you find.
Finally, you must track every single bet. No exceptions. Meticulous record-keeping is the feedback loop that drives improvement. By tracking your wagers, you can analyze your performance, see which types of bets are your moneymakers, and pinpoint any flaws in your model that need fixing. To make this much easier, using a dedicated sports betting tracker can help you organize everything and analyze results with precision. This disciplined approach is what separates the pros from the amateurs, ensuring you're always learning and refining your edge.
Common Questions About Building Betting Models
As you dive into building your own sports betting model, you're bound to run into some questions. It's a path filled with trial and error, but the good news is that most of the challenges you'll face are common ones. Let's tackle some of the most frequent questions I hear, giving you the direct answers you need to keep moving forward.
Can I Really Build a Model with No Coding Skills?
You absolutely can. While knowing a programming language like Python or R certainly opens the door to more advanced techniques, it’s not a requirement to get started. In fact, you can build a surprisingly effective and profitable model using tools you probably already have, like Microsoft Excel or Google Sheets.
These spreadsheet programs are perfect for putting fundamental methods like linear regression into practice. You can use them to organize your data, find statistical relationships between variables (like a team's offensive efficiency and the total points scored), and ultimately calculate your own projected outcomes.
Many successful modelers I know got their start this way, long before they ever wrote a single line of code.
The real key is mastering the logic behind model building. A simple, well-reasoned model in Excel that you understand inside and out is far more valuable than a complex "black box" algorithm you can't properly validate or interpret.
How Much Money Do I Need to Start?
This question really has two parts: the money for building the model and the money for your actual betting bankroll.
For building the model itself, you can get started with literally zero financial investment. There are fantastic free data sources out there (like the Sports-Reference family of sites) and powerful free software (Google Sheets, R, or Python with its open-source libraries). These give you everything you need to begin. Paid data feeds can be useful down the road for automation, but they're a luxury, not a necessity.
When it comes to your betting bankroll, the best advice is to start small. Think of your first bets as an extension of your model testing—they're as much about validating your process in the real world as they are about turning a profit. A starting bankroll of a few hundred dollars is more than enough.
The golden rule is to only bet what you are genuinely comfortable losing. Just as important is using a strict staking plan, like risking only 1-2% of your total bankroll on any single bet.
What Is a Good ROI for a Betting Model?
In the world of sports betting, achieving any consistently positive Return on Investment (ROI) is the goal, and the actual numbers might surprise you. A long-term ROI of 3-5% is widely considered the benchmark for a very successful and strong betting model. If you can sustain an ROI above 5% over a large sample of bets, you're operating at an elite level.
That might sound small, but context is everything. Consider that financial markets often aim for annual returns of 7-10%. A sharp betting model with a 4% ROI can turn over its bankroll many times a week, potentially generating far more substantial returns over the same period.
Be extremely skeptical of anyone claiming a long-term ROI of 20% or higher. While a hot streak can produce incredible short-term numbers, the reality of the market and the vig (the bookmaker's commission) makes sustaining that kind of edge over thousands of bets virtually impossible. Consistency is king.
How Do I Know if My Model Is Any Good or Just Lucky?
This is probably the most critical question you can ask. The answer comes down to two things: rigorous backtesting and a meaningful sample size. A model that looks brilliant over 50 or 100 bets could easily be the product of random chance, something we call variance.
To tell the difference between genuine predictive skill and plain old luck, you have to put your model through its paces.
Here’s what that looks like in practice:
- Go for a Large Sample Size: You should aim for at least 500-1,000 bets in your backtest. This is the minimum to start having a reasonable degree of confidence that your results aren't just a statistical fluke.
- Use Out-of-Sample Testing: Always validate your model on a dataset it has never "seen" before. This is crucial for simulating real-world performance and ensuring you haven't just created a model that's perfectly tuned to historical noise (a problem called overfitting).
- Track Your Closing Line Value (CLV): This is a more advanced but incredibly powerful metric. CLV measures if you are consistently placing bets at better odds than the final, sharpest line before a game starts. A positive CLV is one of the strongest indicators that you have a true, sustainable edge.
If your model holds a positive ROI across a large, out-of-sample dataset and shows positive CLV, you can be much more confident that you've built something genuinely predictive, not just a lucky spreadsheet.
Ready to skip the heavy lifting and get straight to data-driven betting opportunities? ValueBetFactory uses advanced algorithms to find profitable edges for you. Our platform provides real-time alerts, educational tools, and the insights you need to bet smarter. Explore our plans and start finding value today.