
Sports Betting Analytics: Boost Your Winning Strategies
Unlock Profits with betting tips!
Why Your Gut Feeling Isn't Enough Anymore

For generations, sports betting was guided by intuition. A fan's unshakeable belief in their team, a gut feeling about a winning streak, or a simple hunch from watching a few games often sealed the deal on a wager. This traditional approach, however, is quickly becoming a relic of the past. The betting world today is less like a friendly bet and more like a high-speed financial market, where emotions are liabilities and data-backed strategies are the keys to success.
Relying on intuition alone is like trying to navigate a major city using a map you drew from memory. You might stumble upon your destination, but you're far more likely to get hopelessly lost.
The reason for this change is straightforward: the game has evolved. The emergence of sports betting analytics has brought a level of precision and objectivity that gut feelings can't compete with. Top-tier bettors now act like Wall Street traders, searching for market inefficiencies (bad lines) and executing their plays (placing bets) based on methodical analysis. They aren't just guessing; they're calculating.
This shift is happening inside a booming industry. The global sports betting market was valued at USD 100.9 billion in 2024 and is expected to nearly double by 2030. You can see more data about this rapid market growth from Grand View Research. This massive influx of money attracts sharper minds and more advanced techniques, pushing the casual, instinct-based bettor further to the sidelines.
The Cognitive Traps of Intuition
Your brain, for all its power, is full of cognitive biases that can be devastating to your long-term betting profits. These mental shortcuts, while helpful in daily life, lead to predictable patterns of irrational decisions when money is on the line.
- Confirmation Bias: This is our tendency to seek out information that supports what we already believe. If you're convinced the Lakers are going to win, you'll naturally gravitate toward news about their star player's great form and tune out reports on the opponent's lockdown defense.
- Recency Bias: This bias gives too much weight to recent events. A team on a three-game winning streak might seem invincible, causing you to overvalue them, even if their underlying performance metrics are just average.
- Availability Heuristic: You overestimate the chances of events that are easy to remember. A single, spectacular touchdown pass can stick in your mind, leading you to believe a team's offense is stronger than the statistics actually show.
An analytical framework is your best defense against these mental traps. By committing to a consistent, data-first process, you strip the emotion out of the decision. The data doesn't care about a team's popular narrative or a player's fan base; it only cares about the numbers.
From Hunches to Hypotheses
The core change is shifting your mindset from making predictions based on hunches to creating testable hypotheses. A gut feeling says, "I think Team A is going to win." A data-driven approach asks a different question: "Does my model—based on historical performance, player efficiency, and situational stats—give Team A a win probability that is higher than the implied probability from the sportsbook's odds?"
This structured thinking turns betting from a simple gamble into a calculated investment. It requires you to define your edge, measure your results, and consistently refine your methods. This is the critical difference between someone treating betting as a hobby destined for losses and someone building it into a source of systematic profit. The best bettors don't abandon their sports knowledge; they pair it with a strong analytical system that either confirms or rejects their initial ideas with cold, hard data.
Finding Gold in the Data Mine: Essential Information Sources
Successful sports betting analytics isn't about collecting the most data; it's about having the right data. Imagine you're a chef. An overflowing pantry with random ingredients doesn't guarantee a great meal. The magic happens when you select the perfect combination of fresh, high-quality items. Similarly, a sharp bettor understands which information sources offer a genuine edge and which are just background noise.
The starting point for any model is primary team and player statistics. These are the familiar numbers everyone sees in a box score: points per game, yards allowed, or save percentages. While necessary, these figures only scratch the surface. Relying on them alone is like judging a company's health solely by its quarterly revenue—it simply doesn't tell the full story.
Digging Deeper for Unique Angles
The real advantage comes from uncovering less obvious, more specific data points. These are the secret ingredients that create a unique analytical recipe, giving you an edge over the public and even the bookmakers. Building a solid data collection system means searching for overlooked statistical categories that hold predictive power.
Consider these less-traveled paths for information:
- Referee or Umpire Tendencies: Certain officials show statistically meaningful biases. For instance, some NFL referees call holding penalties far more frequently, which can disrupt offensive momentum. A baseball umpire with a tight strike zone can lead to more walks and higher-scoring games.
- Situational Performance: How does a team respond in specific circumstances? Analyze their record on short rest, in cold weather, or during the second game of a back-to-back road trip. These factors often expose patterns that aren't visible in season-long averages.
- Player Tracking Data: Modern sports leagues now provide advanced metrics on player movement, speed, and positioning. In basketball, knowing how many miles a player runs per game can signal fatigue, a critical element for player prop betting.
Evaluating Your Data Sources
As you assemble your data, the reliability of your sources is crucial. Not all information is created equal, and timing is everything. News of a key player's injury is worthless if you learn about it after the betting line has already shifted. Your goal is to find data that is trustworthy, timely, and actionable.
To help you build a complete sports betting analytics strategy, the table below compares different types of data sources, outlining their role and value.
Key Data Sources for Sports Betting Analytics
Comparison of primary data sources showing reliability, cost, and analytical value for different betting strategies
| Data Source | Reliability Score (1-5) | Cost Level | Best Use Case | Update Frequency |
|---|---|---|---|---|
| Official League Websites | 5 | Free | Basic team/player stats, schedules | Daily |
| Advanced Stat Providers | 4 | Mid-High | Deep dive metrics, player tracking | Real-time / Daily |
| Reputable Sports News | 3 | Free/Low | Injury reports, lineup changes | Instant |
| Social Media (Verified) | 2 | Free | Breaking news, player sentiment | Instant |
| Weather Services | 5 | Free/Low | Game-day condition forecasting | Hourly |
By weaving these sources together, you can move beyond simple statistics. You begin to construct a layered view of a game, spotting value where others only see the odds. This disciplined approach to data collection is what separates wishful thinking from a winning, analytical betting strategy.
Statistical Models That Actually Make Money

The goal isn't just to pick a winner. It's to find out when a sportsbook's odds are out of sync with your model's prediction. This is the foundation of a profitable sports betting strategy. For example, if your model shows a team has a 60% chance to win, but the sportsbook’s odds suggest only a 50% chance, you’ve just spotted a potential value bet.
Core Modeling Approaches for Bettors
Different models have different strengths, from ranking teams to simulating entire games. Understanding what each model does best helps you apply its findings correctly. Here are a few fundamental models that sharp bettors often use:
Regression Analysis: This is a workhorse model for discovering relationships between variables. For instance, a simple linear regression can show how a team’s offensive efficiency (points per possession) connects to winning games. You might find that for every extra point of efficiency, a team's win probability climbs by a specific percentage.
Elo Ratings: First created for chess, Elo is a brilliant system for rating team strength. It adjusts a team's power score based on who they beat or lose to, placing more importance on unexpected results. Beating a top-ranked team gives a much bigger boost to a team's Elo score than a win over a last-place opponent.
Monte Carlo Simulations: This method involves running a simulation of a game thousands of times. Each simulation is slightly different due to random factors, like a star player having an off night. By looking at the results of 10,000+ simulated games, you can build a powerful probability map for final scores, point spreads, and totals.
The Rise of Machine Learning
In recent years, artificial intelligence (AI) and machine learning (ML) have become more common in the betting world. These advanced systems can sift through huge datasets to find subtle patterns that simpler models might miss. Industry reports show that operators use this tech to spot trends, offer personalized bets, and adjust odds with greater speed and accuracy. You can explore detailed sports betting market reports to see how deep this integration goes. For the individual bettor, this means the game is always getting tougher.
It's important to remember that more complexity doesn't always mean more success. A simple, well-built regression model using solid data can often be more accurate than a tangled machine learning algorithm that's been poorly trained. The best strategy is to begin with a basic model, test it against past data, and only add more complexity if it clearly improves your predictions.
Building Systems That Remove Emotion From Betting
The most common reason a betting bankroll disappears isn’t a string of bad luck or a flawed statistical model. It’s emotion. A frustrating loss can trigger a reckless “chase” bet, just as a thrilling win can create overconfidence that clouds your judgment. The biggest enemy to long-term profit is the human impulse to react. This is where building a systematic, algorithmic approach becomes essential for anyone serious about sports betting analytics.
Think of a betting system as a strict set of rules that your analysis must follow before a wager is placed. It’s like a pilot’s pre-flight checklist; it ensures no critical step is missed due to haste or a gut feeling. By creating an objective framework, you sideline your emotional biases. The system doesn't care if you "have a good feeling" about a team; it only cares if the data meets the predefined criteria for a value bet.
From Simple Rules to Complex Algorithms
Creating a system doesn't require a degree in computer science. It can start with simple, rule-based logic that you apply consistently. For example, a basic system could be: "Only bet on home underdogs in the NBA when their opponent is playing on the second night of a back-to-back." This is a testable hypothesis you can check against historical data to see if it provides an edge.
As you advance, you might develop your own value betting algorithms. These are essentially automated systems that scan betting markets for odds that your predictive model has identified as mispriced. They can run constantly, spotting opportunities a person might miss. Similarly, arbitrage detection systems hunt for risk-free profit by finding pricing differences across sportsbooks for the same event. These systems require more technical work but are the pinnacle of emotion-free, mathematical betting.
To help you understand the different levels of system complexity, the table below compares various algorithmic strategies.
Algorithmic Betting Strategy Comparison
Analysis of different algorithmic approaches showing complexity, performance expectations, and resource requirements
| Strategy Type | Complexity Level | Expected ROI Range | Time Investment | Technical Requirements |
|---|---|---|---|---|
| Simple Rule-Based | Low | 1-3% | Low (Initial research) | Basic spreadsheet skills (e.g., Excel, Google Sheets) |
| Value Betting | Medium | 3-7% | Medium (Model building) | Python/R, database knowledge, API integration |
| Arbitrage Detection | High | 1-2% (Low-Risk) | High (Constant monitoring) | Fast data feeds, automation scripts, multiple funded accounts |
| Machine Learning | Very High | 5-10%+ | Very High (Ongoing) | Advanced programming, ML frameworks (TensorFlow, Scikit-learn), cloud computing |
This table shows a clear trade-off: simpler systems are easier to start but offer lower returns, while more advanced machine learning models demand significant technical skill and time but have a higher profit ceiling.
To measure any system's success, bettors track key performance indicators. The hierarchy diagram below shows the most important metrics, with Return on Investment at the top.
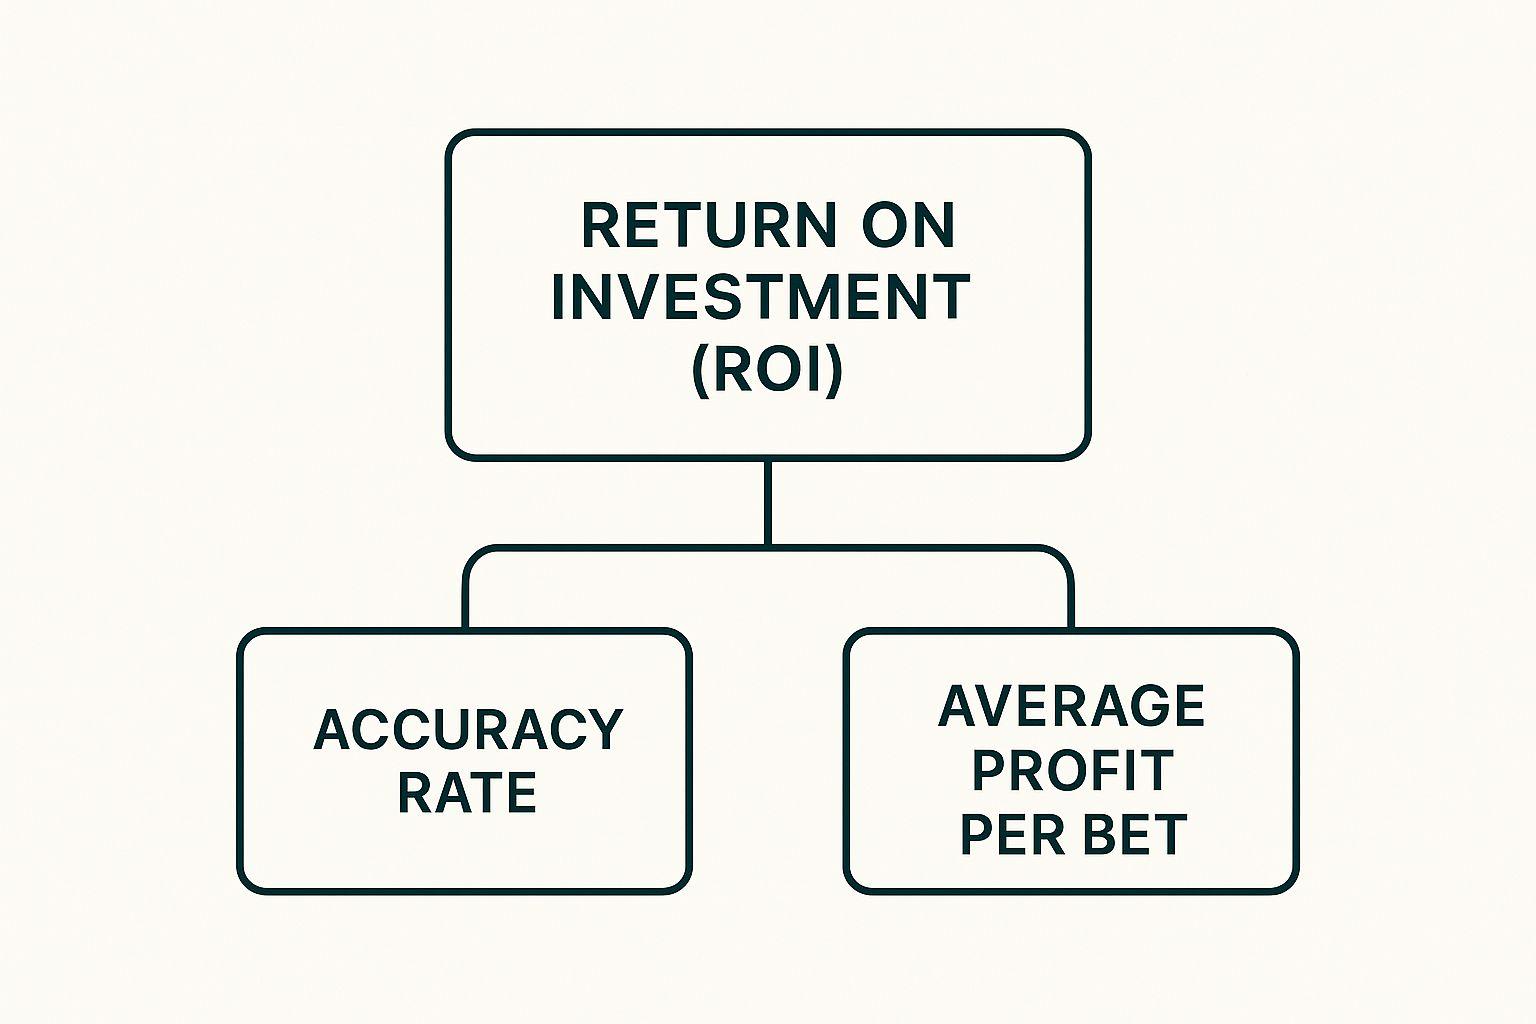
This visual demonstrates that true profitability (ROI) isn’t just about how often you win (Accuracy Rate). It’s also about how much you win on average, which proves the importance of finding value, not just picking winners.
The Cornerstone of a System: Bankroll Management
No system is complete without a disciplined approach to bet sizing. The Kelly Criterion is a well-known formula used to calculate the ideal size of a bet based on your perceived edge and the size of your bankroll. It’s built to maximize long-term growth while minimizing the risk of going broke.
For instance, if your bankroll is $1,000 and your model gives a team a 55% chance to win at even money odds (+100), the Kelly Criterion would suggest a specific, calculated wager (e.g., $100). By using a formula, you avoid the common mistake of betting too much on a single game and protect your capital during inevitable losing streaks. This disciplined money management is what separates sustainable betting from short-term gambling. The true power of an analytical system isn't just in picking winners; it’s in creating a process that is repeatable, measurable, and immune to psychological traps.
From Theory to Practice: Real Analytics Success Stories
It’s one thing to talk about statistical models and data in theory; it's another to see how sports betting analytics leads to real, profitable decisions. The true strength of an analytical approach is its ability to find value that the rest of the market overlooks. This happens every day across all kinds of wagers, from point spreads and game totals to the fine-grained world of player props.
The financial stakes are massive. In early 2025, the global sports betting market was valued at an incredible 329 billion U.S. dollars. With annual revenue expected to reach USD 77.18 billion that same year and continue growing, the industry is a numbers-driven powerhouse. You can discover more about these global sports betting market insights from Statista. This scale attracts sharp analytical minds, making a structured approach essential to stay ahead.
Case Study: Finding Value in NBA Player Props
A classic example of analytics in action is with player proposition bets, or "props." A casual bettor might see a star player's points prop and bet the "over" just because he's a famous scorer. An analyst, however, digs much deeper to paint a complete picture.
Think about a model built for an NBA point guard's assist total. Instead of just relying on his season average, this model would factor in several critical variables:
- Pace of Play: The opposing team plays at one of the slowest tempos in the league, which means fewer possessions and fewer scoring opportunities for everyone.
- Opponent's Defensive Matchup: The point guard is being covered by an elite defensive player known for shutting down passing lanes.
- Team Health: The team's best shooter, who is on the receiving end of 30% of the point guard's assists, is sidelined with an injury.
After crunching these numbers, the model might project the player is most likely to finish with 6.2 assists. If the sportsbook has set the line at 8.5 assists, a huge value gap emerges on the "under." This isn't a hunch; it's a data-backed conclusion that the market has overvalued the "over" based on reputation, not the specific game situation.
Combining Approaches for Live Betting
Live betting, or in-game wagering, is where analytical speed really makes a difference. Imagine a college football game where the pre-game favorite unexpectedly goes down 10-0 in the first quarter. Public perception often sways heavily with the score, and the live odds will quickly shift to favor the team that's currently ahead.
An analytical system, however, offers a much more objective perspective. A sharp bettor could blend two different approaches:
- Pre-Game Model: Their initial analysis gave the favorite a 70% probability of winning the game.
- Live Data Feed: The system processes play-by-play data and notices the trailing team is actually winning the yardage battle. They’ve had two promising drives stall because of unlucky turnovers, not because they are being outplayed.
The system concludes that despite the 10-0 deficit, the favorite's underlying performance is still strong, and their true live win probability should be closer to 60%. But the new live odds now suggest they only have a 40% chance to win. This is a perfect moment to bet on the original favorite at a huge discount, taking advantage of the market's emotional overreaction. For bettors who want this level of insight, grasping the methods of professional sports betting is vital.
Maintaining Discipline and Compounding Edges
The chart below visualizes the projected revenue growth in the sports betting market, showcasing the immense financial landscape where these analytical advantages are being pursued.

This data shows a growing and increasingly competitive field where small, consistent edges are the path to long-term profit. Success isn’t about landing one massive win. It’s about repeatedly finding small advantages—like the player prop or live betting examples—and letting those profits build on each other.
This requires strict discipline, especially when your analysis goes against popular opinion. While the crowd bets with their gut, the analyst trusts the process. They know that even a 2-3% edge, when applied over and over, is what builds a significant bankroll over time.
Avoiding the Traps That Destroy Smart Bettors
Building a killer analytical model is a huge step, but it's only half the journey. Even the sharpest sports betting analytics can lead to devastating losses if you stumble into common psychological and statistical traps. These pitfalls are tricky because they often disguise themselves as smart, data-informed decisions. Learning to spot them is what separates bettors who profit consistently from those who crash and burn after a hot streak.
One of the most common mistakes is overfitting a model. Think of it like tailoring a suit to fit a store mannequin perfectly—every angle and curve is matched with precision. It looks amazing on that specific mannequin, but it won’t fit any real person who tries it on. In the same way, a model that’s too closely tied to past data will perfectly "predict" old games but crumble when used for future matchups. It confuses random noise with a genuine pattern. The goal is to build models that find broad, repeatable trends, not ones that just memorize history.
The Pitfalls of Bias and Misinterpretation
Beyond overfitting, several cognitive biases can sabotage a data-first approach. These mental shortcuts are part of how we think, and it takes real effort to recognize and counter them.
Survivorship Bias: This happens when you backtest a strategy by only looking at the winners, completely ignoring all the failures. For instance, if you only analyze teams that made the playoffs, you might conclude that risky, all-out offensive plays are a secret to success. You'd miss the hundreds of other teams that tried the same thing and failed miserably.
Confusing Correlation with Causation: This is a classic statistical blunder. You might notice that a certain basketball team always wins when their star player wears a red headband. While there's a correlation, the headband isn't causing the wins. Betting on a superstition while ignoring the real factors—like the quality of the opponent or home-court advantage—is a surefire way to lose money.
Staying objective is everything. Your model might spit out a result that flies in the face of public opinion or even your own gut instinct. The whole point of using sports betting analytics is to let data guide you, not emotion. It takes discipline to follow the numbers when your model tells you to bet against a fan-favorite team.
Protecting Your Progress
Finally, even the most accurate analytical process will hit a losing streak. This is where solid bankroll management acts as your safety net. It safeguards your capital during those inevitable downswings, making sure you can stay in the game long enough for your statistical edge to pay off. Without it, a short run of bad luck can wipe you out, no matter how good your analysis is.
Constant improvement is important, but don't fall into the trap of perfectionism. If you get so lost in tweaking your model for an extra 0.1% of accuracy that you never actually place a bet, you’ve missed the point. The aim is to build a solid, profitable system, not an academic masterpiece that never sees action. It's also smart to learn how to avoid bookmaker limitations; for more on this, check out our guide on how to stay under the radar and keep your accounts active.
Your Personal Analytics Roadmap
Making the switch from casual betting to a data-driven approach is a journey, not a sprint. Just like you wouldn't try to climb a mountain without a map, you shouldn't jump into sports betting analytics without a clear plan. Building a personal analytics roadmap means creating a framework that fits your goals, your available time, and your current tech skills. The point isn't to build the most advanced system overnight, but to create a steady workflow that improves your decisions without burning you out.
Think of it like starting a new fitness plan. Someone new to the gym doesn't walk in and immediately try to lift the heaviest weights. They start with basic exercises, perfect their form, and slowly increase the intensity. Your journey into analytics should follow the same path: start with the fundamentals, build a solid foundation, and then scale up as you gain more experience. Trying to run a complex machine learning model before you even know how to calculate expected value is a recipe for frustration.
Charting Your Course: From Beginner to Advanced
The right place to start depends entirely on you. The first step is to be honest about how much time you can commit and how comfortable you are with technology. Not everyone needs to become a programmer to find an analytical edge. There are multiple paths to success, and your initial goal is to pick the one that fits you best and gets you moving in the right direction.
Here’s a look at different entry points, with realistic expectations for time and resources at each stage.
| Skill Level | Time Investment (Weekly) | Core Tools & Resources | Primary Goal |
|---|---|---|---|
| The Enthusiast | 2-5 Hours | Spreadsheets (Google Sheets, Excel), free sports statistics websites. | Master fundamental concepts like implied probability and basic record-keeping. |
| The Analyst | 5-10 Hours | Spreadsheets with advanced formulas, basic data scraping tools, historical odds databases. | Develop and backtest simple rule-based betting systems. Find value in major markets. |
| The Developer | 10+ Hours | Programming languages (Python with libraries like Pandas), database management, API access. | Build and automate predictive models, run simulations, and scan for market inefficiencies. |
As the table shows, you can start making more informed bets with just a few hours a week and a simple spreadsheet. The key is consistency. Spending three focused hours every week is much more effective than an occasional, all-day cram session.
Building Your Foundational Workflow
No matter your skill level, every effective sports betting analytics process has a similar structure. Creating a repeatable workflow is essential for tracking your performance and figuring out where you can improve. This system brings discipline to your analysis and ensures you don't skip important steps.
Here’s a simple, four-step process to get you started:
- Data Collection: Systematically gather the data you need for your analysis. For an Enthusiast, this might be as simple as manually typing team stats into a spreadsheet. For a Developer, it could be an automated script pulling data from several APIs.
- Analysis & Modeling: Apply your chosen analytical method. This could be as straightforward as comparing two teams' recent performance on a spreadsheet or as involved as running a Monte Carlo simulation.
- Execution & Record-Keeping: Place bets based on your analysis and meticulously record every single detail: the date, teams, bet type, odds, stake size, and your reasoning. This is non-negotiable.
- Review & Refine: Regularly go over your results. Are you winning more on totals than spreads? Do your underdog bets show a positive return? Use this feedback to adjust your models and improve your process.
This feedback loop is what powers long-term success. Your first models will probably have flaws, and that’s okay. The goal isn't instant perfection but steady improvement. By tracking your performance, you can honestly see what’s working, what isn’t, and adapt your strategy as you learn and as the betting markets change.
Ready to stop guessing and start analyzing? ValueBetFactory provides the tools and insights to find mispriced odds and make smarter betting decisions. Our platform uses powerful algorithms to deliver real-time alerts on value opportunities, giving you the edge you need. Explore ValueBetFactory today and begin your journey toward profitable, data-driven betting.