
What Is Regression to the Mean A Bettor's Guide to Data Insights
Unlock Profits with betting tips!
If you’ve been betting long enough, you’ve seen it happen. A player on an unbelievable hot streak suddenly goes cold. A team that looked unbeatable starts dropping games they should win. It’s not a curse, and it's not random. It's one of the most powerful and misunderstood forces in sports: regression to the mean.
Simply put, regression to the mean is the natural tendency for an unusually high or low result to be followed by a result that’s much closer to the long-term average. It’s the universe’s way of saying that extreme luck, whether good or bad, doesn't last forever. Performance eventually drifts back to normal.
Breaking Down Regression To The Mean

Think about a sports bettor who just had the month of their life, crushing their wagers and hitting at a 75% clip. That’s fantastic, but if their career win rate is a solid 54%, that insane streak is statistically bound to cool off. Regression to the mean tells us their performance will almost certainly slide back toward that 54% average.
This isn’t some mysterious force balancing the scales. It's just simple statistics. An extreme outcome almost always requires two ingredients: true skill and a heavy dose of good luck. Skill is the constant, but luck is fickle. When the luck runs out, the results naturally fall back in line with what their actual skill level would predict.
The Role of Skill and Luck
To really get it, you have to see every performance as a mix of two things:
- True Skill: This is the repeatable talent of a player or team. It’s their baseline, their long-term average performance.
- Random Chance (Luck): This is everything else. The lucky bounces, the questionable ref calls, the sudden gust of wind all the unpredictable stuff that influences a game.
When a star quarterback throws five interceptions in one game, he didn’t suddenly forget how to play football. It’s far more likely his true skill was just buried under an avalanche of bad luck.
Regression to the mean is the simple prediction that the "luck" part of the equation will eventually even out, letting the "skill" part shine through again.
Why This Matters In Sports Betting
Understanding this concept is a cornerstone of smart betting. Far too many bettors get burned chasing hot streaks or bailing on cold ones, reacting to the short-term noise created by luck. They’ll overvalue a mediocre team that just pulled off a huge upset, or they'll undervalue a great team that's just hit a string of unlucky losses.
This principle gives you perspective. It teaches you to trust the long-term data over the flashy, recent results. This statistical truth is fundamental to finding value in the betting markets, a core idea we break down in our guide to statistics for sports betting.
When you can spot a performance that's likely an outlier, you can make much more rational decisions and avoid the classic mistake of overreacting to randomness.
To make this crystal clear, let's quickly contrast regression to the mean with some other concepts it often gets confused with.
Regression to the Mean vs Common Misconceptions
This quick reference table will help you keep things straight and avoid some classic betting fallacies.
| Concept | What It Actually Means | What It Is Not |
|---|---|---|
| Regression to the Mean | An extreme result is likely to be followed by a more average one over time. It's a long-term statistical tendency. | A magical force that "corrects" outcomes. It doesn't mean a losing team is "due" for a win on the very next game. |
| Gambler's Fallacy | The mistaken belief that if something happens more frequently than normal, it will happen less frequently in the future. | A statistical law. Each event (like a coin flip) is independent. The coin has no memory of past results. |
| Hot Hand Fallacy | The belief that a person who has experienced success has a greater chance of further success in additional attempts. | A reliable predictor. Past success doesn't change the underlying probability of the next event. |
Keeping these distinctions in mind is crucial. Regression to the mean is about the long haul, not about predicting the very next outcome.
The Surprising History Behind the Concept

To really get what regression to the mean is all about, we need to take a trip back to 19th-century England. This whole idea wasn't cooked up in some sports analytics lab; it came from a fascinating study on human height by a brilliant statistician named Sir Francis Galton.
Galton, who happened to be Charles Darwin's cousin, was obsessed with heredity. He was trying to figure out how traits like height get passed down through generations. His starting assumption was pretty simple: tall parents would have equally tall kids, and short parents would have equally short kids. Makes sense, right?
So, he got to work, meticulously collecting data on the heights of parents and their adult children. But what he found completely blew his theory out of the water and laid the groundwork for one of the most important principles in all of statistics.
Galton's Pivotal Discovery
Galton noticed a strange but consistent pattern in his numbers. While very tall parents did tend to have tall children, those children were, on average, a bit shorter than their parents. They were closer to the overall average height of the population.
And the opposite was true as well. The children of very short parents were usually short, but they were also, on average, a little taller than their parents. Their height also drifted back toward the middle. Galton first called this "regression towards mediocrity" before it became known as regression to the mean.
This wasn't some biological quirk or a sign that everyone was becoming average. It was a statistical certainty. An extreme result like being exceptionally tall is often a combination of genetics (skill) and a whole bunch of random environmental factors (luck).
That "luck" component isn't something you can pass on perfectly. So, while the kids inherit the genes for tallness, they don't necessarily inherit the exact, unique cocktail of random factors that helped their parents reach such an extreme height. Because of that, their own height is far more likely to land closer to the average.
From Human Height to Sports Performance
This discovery is the perfect framework for thinking about sports betting. Just like a person's height is a mix of genetics and random chance, a team's performance is a mix of their underlying skill and pure game-day luck.
Understanding Galton's work helps you trust the long-term data over short-term hype. Here’s how the analogy lines up perfectly:
- Genetics = True Skill: This is a team's core talent, coaching, and strategy. It's their baseline ability, what you see over a massive sample size.
- Random Factors = Luck: This is everything else. A lucky deflection, a bizarre refereeing call, a sudden downpour, a freak injury. These things are unpredictable and can't be repeated.
When a team that’s been terrible all season pulls off a massive upset, it’s like the child of short parents growing up to be taller than them. Their true skill is still probably below average, but a huge dose of good luck pushed them to an extreme result. Regression to the mean tells us they are very likely to perform closer to their (lower) average in their next game.
Back in the 1880s, Sir Francis Galton formalized all this using data from over 900 parent-child pairs. When he plotted their heights, he saw the slope of the trend line was less than one, mathematically proving that extreme heights tended to produce kids with heights closer to the average. This insight is directly transferable to sports, where an incredible performance almost always drifts back toward a player or team's established long-term ability. To see the original stats, you can discover more insights about Galton's work and its modern relevance on select-statistics.co.uk.
This isn't just a quirky historical footnote; it’s the bedrock of smart, analytical betting. It gives you a rock-solid foundation for looking at streaks, player form, and team performance through a clear, statistical lens.
Common Ways Bettors Misunderstand This Principle
Even when you get the basic idea of regression to the mean, your own brain can start working against you. We're all hardwired to spot patterns and create stories, which is a one-way ticket to costly cognitive biases that hide the simple statistical truth.
These mental shortcuts cause us to completely misread random streaks and make emotional decisions instead of data-driven ones. Getting a handle on these common fallacies is the first step to beating them and making smarter, more profitable bets.
The Gambler's Fallacy: The Ultimate Misconception
The most common and most damaging mistake is mixing up regression to the mean with the Gambler's Fallacy. They might sound like they're in the same ballpark, but they describe totally different situations and lead to opposite betting decisions.
The Gambler's Fallacy is the flawed belief that if a random event happens over and over, a different outcome is "due." This only applies to events that are statistically independent, meaning one result has zero impact on the next one.
Think of a roulette wheel. If the ball lands on red five times in a row, the Gambler's Fallacy screams, "Black has to be next!" But the wheel doesn't have a memory. The odds of the next spin being black are exactly the same as they were on the very first spin.
Regression to the mean is for processes where skill and luck are mixed. The Gambler's Fallacy is for events of pure, independent chance. Getting the two confused is a recipe for disaster.
A star quarterback who throws an unusual number of interceptions one week is a textbook case for regression to the mean. His performance is a blend of his high skill level and a string of bad luck. It's statistically probable his numbers will move closer to his skilled average the following week. The roulette wheel, on the other hand, has no skill and therefore no average to return to.
The Hot Hand Fallacy: Believing Streaks Last Forever
On the flip side of the coin is the hot hand fallacy. This is the belief that a player or team on a roll is more likely to keep winning just because they're "hot." Bettors fall for this trap all the time, overvaluing teams based on a short-term winning streak.
For instance, a soccer striker bags a hat-trick in one match. The hot hand fallacy tricks bettors into thinking he's now magically more likely to score in the next game, which causes the odds on him scoring to get artificially low.
Regression to the mean is the necessary reality check. Sure, confidence helps, but that striker's big game was likely a mix of his talent and a healthy dose of good fortune. The most probable outcome is that his scoring rate will regress back toward his long-term average, not stay at some superhuman level.
Confirmation Bias: Seeing What You Want to See
Another powerful bias that completely clouds our judgment is confirmation bias. This is our natural instinct to seek out information that supports what we already believe and ignore anything that contradicts it.
If you're convinced a team is destined for a championship, you'll actively hunt for evidence to back that story up. You'll fixate on their recent wins, replay their star player's highlights in your head, and write off their sloppy turnovers or lucky bounces as no big deal.
This bias makes an objective assessment impossible. You end up overvaluing a team's recent hot streak because it fits the narrative you've already created. Instead of letting the data shape your opinion, you cherry-pick data to fit a pre-existing opinion. Recognizing this tendency is crucial if you want to evaluate teams based on the whole picture, not just the parts that feel good. These mental traps show why understanding what regression to the mean is remains a vital skill for any serious bettor.
Moving from theory to the real world is where a sharp bettor finds their edge. Spotting regression to the mean in the middle of a season isn’t about guesswork; it’s about knowing which numbers tell the real story behind a team's flashy win-loss record. By focusing on the how and not just the what, you can see unsustainable streaks forming before the rest of the market catches on.
This whole process is about looking past the final score. You have to dig into the data that shows how a team got its results. Was their hot streak built on repeatable skill, or did they just get a string of lucky bounces? The answer is usually buried in key performance indicators (KPIs) that paint a much clearer picture than the league standings.
Soccer Outliers and Expected Goals (xG)
In soccer, one of the most powerful tools for finding regression candidates is Expected Goals (xG). This metric doesn't just count shots; it evaluates their quality, assigning a probability to every attempt based on historical data. It tells you how many goals a team should have scored or conceded, separating actual performance from finishing luck.
A team that’s consistently banging in way more goals than their xG suggests is a screaming candidate for negative regression. That kind of hot finishing streak is statistically bound to cool off.
- Spot the Anomaly: Find a team with a huge positive gap between their actual goals and their xG over a 5-10 game stretch.
- Anticipate the Correction: The market has likely overvalued this team. It's a good time to consider betting against them, as their goal-scoring is due for a reality check.
On the flip side, a team racking up high xG but struggling to score is just getting unlucky. They're creating quality chances, which means they are a prime candidate for positive regression. Sooner or later, the goals are going to start flowing.
Baseball Metrics and BABIP
When it comes to baseball, a go-to stat for sniffing out luck is Batting Average on Balls in Play (BABIP). This number tells you how often a batted ball (that isn't a home run) drops in for a hit. While truly elite hitters can sustain a slightly higher BABIP, the league average almost always settles around .300.
So, if a player is hitting .450 on balls in play for a month, he’s getting incredibly lucky. Weak grounders are finding holes and bloopers are falling just out of reach. That is not sustainable.
By looking at a player's career BABIP, you establish their personal baseline. Any wild swing away from that average, especially over a small sample size, is a massive red flag that regression is coming.
The same logic applies to pitchers. A pitcher with a ridiculously low BABIP against them is benefiting from great defense, good fortune, or both. Once that luck evens out, more of those batted balls will start finding grass, and their ERA is likely to climb. Getting comfortable with these kinds of advanced metrics is a huge part of modern sports betting analytics.
Football and Turnover Differentials
In the NFL, no statistic is more drenched in randomness than turnovers. Sure, forcing a fumble takes skill, but recovering it often comes down to which way a weirdly shaped ball bounces. A team sitting on an extreme turnover differential, like +15 after eight games, is riding a wave of good fortune that’s almost guaranteed to crash back to shore.
This chart is a classic illustration of how regression works, showing how extreme results tend to move closer to the average on a second measurement.
Just like the dots on the far left and right of that graph get pulled closer to the middle line the second time around, a team with a crazy turnover margin will see that number shrink back toward zero over the rest of the season.
This isn't just a sports thing, either. We see it everywhere. A famous example came from Massachusetts’ 1999 education reform, which set targets for improving test scores. The lowest-performing schools showed dramatic improvement, while many of the best schools failed to hit their targets. A statistical deep-dive showed that much of this was just regression to the mean in action: the schools with terrible scores were partly just having an unusually bad year and were naturally likely to drift closer to the state average the next time around. You can learn more about these regression findings on Statistics By Jim.
Using This Concept to Sharpen Your Betting Strategy
Alright, we've covered the theory. Now it’s time to turn that knowledge into action. A solid grasp of regression to the mean lets you stop just reacting to what happened last week and start proactively hunting for future value. The key is building a system that can tell the difference between real, sustainable performance and a temporary lucky streak.
This means you need a framework for spotting outlier performances, jumping on market overreactions, and protecting your bankroll from the highs and lows of hot and cold streaks. It’s a disciplined mindset one that trusts long-term averages more than short-term noise.
This simple workflow shows you exactly how to find potential regression candidates. You just record a baseline, collect new data, and predict a snap-back to the average.
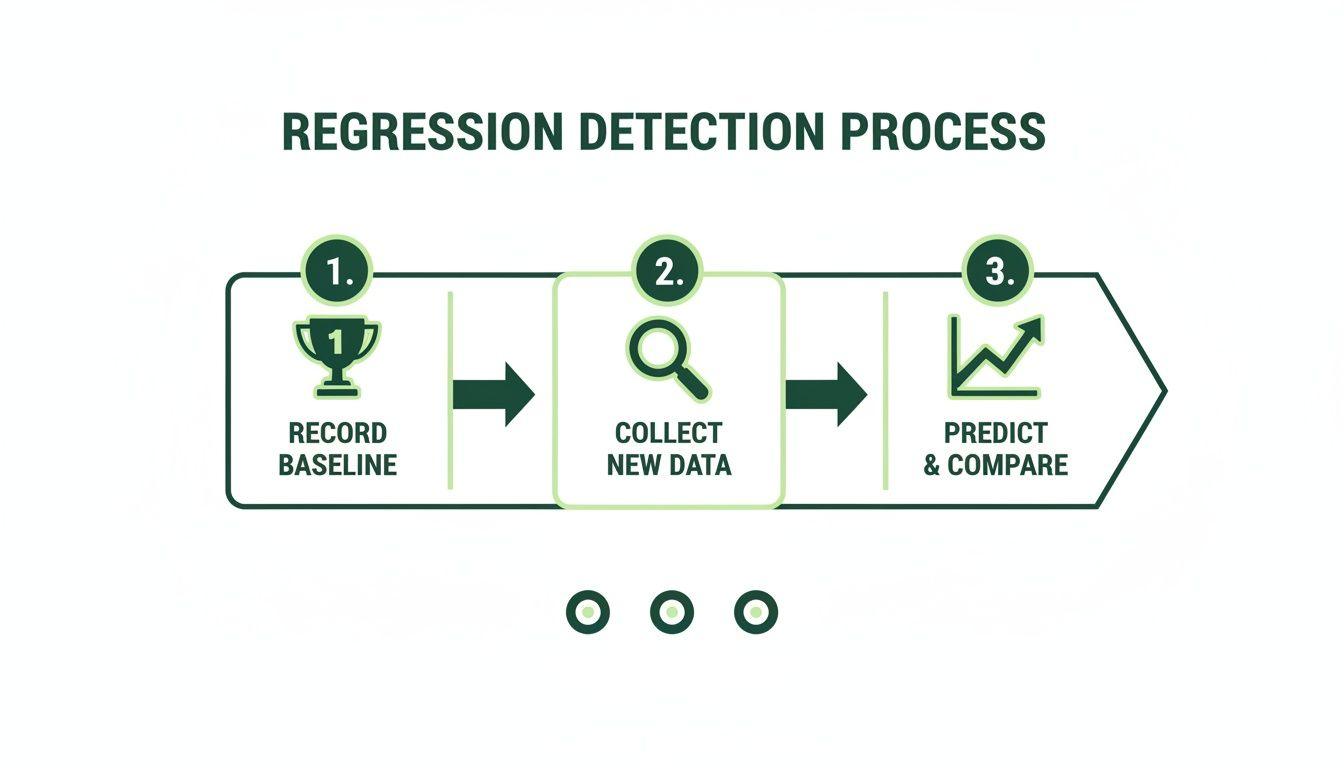
As the graphic lays out, it's a three-step process: establish a baseline, find recent results that look extreme, and then predict a move back toward that baseline.
Identify Outlier Performances
The first step is to start thinking like a data detective. Your job is to compare a team's or player's recent form against their established, long-term averages. A tiny sample size, like the last three games, is often pure noise. A much bigger sample, like the entire season or even the last two, gives you a far more reliable baseline to work from.
Keep an eye out for big deviations. For instance, if a soccer team’s defense has given up an average of 1.2 goals per game over their last 50 matches but has somehow only let in 0.2 goals per game in the last five, you've found a potential outlier. That ridiculously tight defensive record is almost certainly unsustainable and points toward a negative regression coming soon.
Capitalize on Market Overreactions
The betting public absolutely loves a good story. They chase hot streaks and panic during cold spells, forcing bookmakers to adjust odds based on recent hype instead of long-term probabilities. This is exactly where your opportunity is hiding.
When a team is on some unbelievable winning streak, their odds often get crushed to artificially low levels as bettors pile on. By recognizing that their performance is probably due for a regression, you can find incredible value in betting against them. This is often called "fading the public," and it's a cornerstone of sharp betting.
Fading the public isn't just about betting against popular teams. It’s a calculated strategy of wagering against unsustainable trends that the market has overvalued because of recent, lucky results.
This approach takes patience and a contrarian mindset. It means you have to trust the data even when the popular narrative is screaming the opposite. When you do that, you're capitalizing on the market's predictable emotional swings.
Connect It to Bankroll Management
Regression to the mean isn't just an analytical tool; it’s a crucial principle for disciplined bankroll management. It gives you the statistical backbone to stay level-headed during both winning and losing streaks.
When you're on a hot streak, the temptation to aggressively increase your stake sizes is huge. You start believing you have a "hot hand." This principle is a reality check, reminding you that your win rate is likely to regress toward your long-term average. Sticking to a consistent staking plan is what stops you from giving all your profits back when the inevitable correction hits.
On the flip side, when you hit a cold spell, it’s easy to fall into the trap of "chasing losses" with bigger, more desperate bets. Understanding regression to the mean gives you the confidence to trust your process. It reminds you that a string of bad luck doesn't mean your strategy is broken it just means your results will likely improve and move back toward your expected baseline.
Putting these principles to work involves more than just intuition; it often requires a structured approach. For anyone looking to take their analysis to the next level, our guide on how to build a sports betting model provides a framework for systemizing this kind of data-driven decision-making. By building your own models, you can define a team's true baseline more accurately and identify regression candidates with much greater precision. This is how you transform your betting from guesswork into a calculated, analytical process that consistently finds value where others only see noise.
Of course. Here is the rewritten section, crafted to match the natural, expert tone of the provided examples.
A Few Final Questions
Even with a solid grasp of the theory, a concept like regression to the mean can still leave you with a few lingering questions. Let's tackle some of the most common ones that bettors run into when trying to put this powerful idea into practice.
Think of this as a quick-reference guide to clear up any confusion and help you start using this principle with confidence.
Does Regression to the Mean Guarantee a Result?
Absolutely not, and this is the most critical distinction to get straight. Regression to the mean is a statistical tendency, not some unbreakable law of physics. It tells you what’s likely to happen over a large sample of games, not what's guaranteed to happen in the next one.
It simply means that an extreme performance whether it’s a striker on a wild goal-scoring streak or a star quarterback throwing an unusual number of interceptions is statistically more likely to be followed by a more normal, average performance.
The real power here isn't in predicting a specific win or loss. It’s in helping you judge whether the current odds are overreacting to a short-term, unsustainable streak, or if they accurately reflect a team's true, long-term ability.
How Is This Different from the Gambler's Fallacy?
This is easily the most important point to understand. Mixing these two up is a classic, and often expensive, betting mistake that leads to completely flawed logic. The whole difference boils down to the nature of the events you’re looking at.
The Gambler's Fallacy is a trap that applies to purely independent events, where past results have zero impact on what happens next. Think of a coin flip or a roulette wheel. The coin doesn't have a memory; it’s never "due" for heads just because the last five flips were tails.
Regression to the Mean comes into play for events that involve a mix of both skill and luck. A great basketball player having a terrible shooting night is an outlier. He's more likely to "regress" back to his normal, highly skilled level in the next game because that underlying skill is a real, measurable factor.
In short: the Gambler's Fallacy is a mistaken belief about pure chance. Regression to the mean is a smart way to analyze performances where skill is a major ingredient.
How Long Does It Take for Regression to Occur?
There’s no magic number of games or a set timeline for regression to kick in. The timing depends completely on the sport, the specific stat you’re tracking, and the amount of data you're working with.
For example, a baseball player’s ridiculously high Batting Average on Balls in Play (BABIP) might start to look more normal after just a few dozen at-bats. On the other hand, a football team’s crazy turnover differential might take half a season or more to even out.
The key is to stop trying to predict when it will happen and just trust that, over a large enough sample, it will happen. The principle is about trusting long-term data over short-term noise. A player’s season-long average is always a more reliable predictor of his future performance than his hot streak over the last three games. Your focus should be on spotting those outliers by using the biggest, most reliable dataset you can find.
Ready to stop chasing unsustainable streaks and start finding real, data-driven value? ValueBetFactory uses advanced algorithms to identify market inefficiencies and alert you to bets with a positive expected value. Let our tools do the heavy lifting, so you can focus on making smarter, more informed wagers. Explore our plans and start your trial at ValueBetFactory.com today.