
How to Use Public Betting Percentages to Win More Bets
Unlock Profits with betting tips!
Public betting percentages are your window into the mind of the market. They show you exactly where the majority of bets are being placed on a game, essentially revealing the popular opinion. This data tells you which side the general public is backing, giving you a real-time snapshot of market sentiment before a matchup even begins.
What Public Betting Percentages Reveal About a Game

Think of public betting percentages as a popularity contest for wagers. It’s a direct measurement of which team or outcome the betting public is collectively putting its money behind. This isn't some vague poll; it's built on real money and actual bets placed at sportsbooks.
This information is typically broken down into two distinct categories, and understanding the difference between them is where the real insights are found.
Bet Percentage vs. Money Percentage
First up is the bet percentage. This number represents the sheer volume of individual betting slips, or tickets, placed on one side of a game. If 1,000 total bets are placed on a game and 700 of them are on Team A, then Team A has a 70% bet percentage. This metric tells you what the masses are thinking.
But the more interesting story often comes from the money percentage, which shows the total amount of money wagered on each side. A team might have a high bet percentage from thousands of small, casual wagers, but a low money percentage if a few huge, significant bets are placed on their opponent.
For example, in a highly anticipated NBA playoff game, you might see 80% of individual bets backing the popular home team. However, the money percentage could be closer to a 50/50 split. This signals that a few large wagers from professional bettors are balancing out the thousands of smaller public bets.
Grasping this split is your first real step toward moving beyond casual betting. It's not about just following the crowd. Instead, analyzing public betting percentages is about spotting where the crowd's opinion might be creating hidden value. For a deeper dive into the numbers that drive these insights, our guide to essential sports betting data provides additional context.
Decoding Crowd Sentiment
So, why does any of this matter? Because the betting market, just like any financial market, is driven by supply and demand. Heavy public betting on one side can directly influence the odds offered by sportsbooks.
- Identifying Lopsided Games: You can instantly spot matchups where the public is overwhelmingly piling on one side. Games where over 75% of bets are on a single team often present unique opportunities.
- Finding Contrarian Value: When the public heavily favors one team, sportsbooks often adjust the betting line to encourage action on the other side. This adjustment can create fantastic value for bettors willing to go against popular opinion.
- Spotting Sharp Money: A big difference between the bet percentage and the money percentage is often the first clue that professional bettors the "sharps" disagree with the public.
Ultimately, public betting percentages give you a peek behind the curtain. They reveal the market's collective psychology, creating a starting point for finding bets where the popular choice might not be the smartest one.
How Public Betting Data Is Collected and Tracked
To really see the power in public betting percentages, you first have to get where the numbers come from. This isn't guesswork or some fluffy opinion poll. It's a direct reflection of real money flowing through the veins of major sportsbooks.
Every single bet placed from a small weekend wager to a high-stakes play by a pro feeds into this massive stream of information. It gives us an unfiltered look at what the entire betting market is thinking and doing.
Major data providers and the sportsbooks themselves pool this information in real-time. They collect millions of individual wagers to paint a crystal-clear picture of market sentiment. This is a huge leap from the old days of "consensus picks," which were often just a jumble of disconnected opinions. Today's data is alive, constantly updating with every new bet.
This constant flow allows algorithms to track market movements with incredible precision, turning a sea of raw numbers into insights you can actually use. You can see this data in action on platforms like Action Network and VSiN, which give you daily snapshots of where the money is headed.
From Wager to Percentage
The journey from a single bet to a data point you can analyze happens in the blink of an eye. The moment you place a wager at an online sportsbook, that information is instantly logged and pooled with thousands of others.
Here's a quick look at how it works:
- Bet Placement: A bettor locks in a wager on a specific team or outcome.
- Data Aggregation: The sportsbook’s system logs the bet, noting the side chosen and the amount staked.
- Real-Time Polling: Data providers pull this information from multiple sportsbooks, often refreshing every few seconds.
- Percentage Calculation: The aggregated data is crunched to show the bet and money percentages for each side of the action.
This is the machinery that makes modern, data-driven betting possible. It’s not some theoretical model; it’s a direct report from the front lines of the betting marketplace.
This real-time tracking has completely changed how bettors read the market since the late 1990s. Back then, pioneers in the field started collecting actual bet data polled every one to five seconds from multiple books, a massive shift away from unreliable consensus sites.
Understanding the Sources
It’s critical to know this data reflects genuine wagers from real people. For instance, in MLB or NHL games, it's not uncommon to see the public pile 65% or more of their money on the over in matchups that scream "high-scoring." For big NFL primetime games, that number can jump to 70-80% of the public backing a popular home favorite.
You can even see daily snapshots, like a recent college basketball game where 51% of public bets landed on one side of a +16.5 spread. This activity is all part of a global market that has ballooned to $70.69 billion for sports betting alone. You can explore more about how these percentages are collected and used at SportsInsights.com.
This constant feed of information is the lifeblood of many sharp betting strategies. It gives you a clear, unbiased look at how the entire market is behaving. Once you understand how this data is collected, you can start to trust its power and weave it into your own analysis, turning public sentiment into your private advantage. The next step is learning how to act on these numbers.
A Practical Guide to Fading the Public
Knowing the numbers is one thing, but knowing how to act on them is where the real money is made. This is where we stop being students of the market and start using a powerful contrarian strategy: "fading the public." At its core, it’s about betting against the popular opinion, especially when that opinion gets a little too loud.
Fading the public isn't about blindly betting against the crowd on every single game. It’s a calculated move that takes advantage of the predictable, emotional biases that consistently lead casual bettors down the wrong path.
Why the Public Tends to Lose
Let’s face it, the general betting public is often driven by heart, not by data. They're betting on media hype, star players, and gut feelings, not cold, hard numbers. This creates some pretty reliable patterns that sharp, disciplined bettors can turn into profit.
A few common habits of the betting public include:
- Favoring Popular Teams: Big-name franchises with huge followings think the Cowboys or the Lakers suck in a ton of public money, often without any regard for their actual form or the matchup.
- Backing Home Favorites: There’s just something comfortable about betting on the home team, especially when they’re favored. The public almost always overvalues home-field advantage.
- Loving the 'Over': Casual bettors want to see action. Cheering for points and exciting finishes is way more fun than hoping for a defensive slog, which is why they hammer the "over" far more than the "under."
These biases create a massive market inefficiency. When a flood of public money pours onto one side of a bet, sportsbooks have to adjust the line to limit their risk. In doing so, they often inflate the value on the other side, creating a golden opportunity for anyone paying attention.
The Golden Rule of Fading
This predictable behavior gives us a clear, actionable rule of thumb. When you see the public betting percentages get incredibly lopsided, it’s a bright, flashing sign that a fading opportunity might be staring you in the face.
A common trigger for a contrarian bet is when 70-75% of the public is on one side of a game. This level of consensus often means the betting line has been pushed too far in one direction, creating a valuable entry point on the other side.
This is where public betting data becomes your window into the market's mind. Platforms like VSiN and Covers track these splits in real-time, showing you exactly where the majority is leaning. For instance, in one historical NFL game, the public was all over the Dallas Cowboys, with 52% of spread bets and a whopping 73% of moneyline bets on Dallas. Statistics show that when public betting hits 75% on NBA favorites, underdogs have covered the spread about 55% of the time over the last five years. You can dig into similar odds and trends across different sports by checking out betting results on OddsPortal.
An NFL Fading Example in Action
Let's walk through a classic scenario. The Green Bay Packers, a team with a massive national fanbase, are set to play the Detroit Lions. The opening line is Packers -6.5. As the week goes on, 80% of the public bets come pouring in on the Packers, fueled by their star quarterback and media hype.
To protect themselves, the sportsbook moves the line to Packers -7, then -7.5, and maybe even -8 to encourage some action on the Lions. The original line of -6.5 might have been spot-on, but this new -8 line is artificially inflated by public pressure. This is precisely where a sharp bettor sees incredible value in taking the Lions +8. They aren't just betting on the Lions; they're betting against a bad number. This distinction is key, and you can learn more about how pros think in our guide on sharp money betting.
Public Bettor vs Sharp Bettor Tendencies
The difference in how a casual fan and a professional bettor approach a game is night and day. While the public is busy chasing popular narratives, sharps are on the hunt for the value created by those exact same stories. The table below breaks down this fundamental contrast.
Public Bettor vs Sharp Bettor Tendencies
| Betting Characteristic | Public Bettor Tendency | Sharp Bettor Tendency |
|---|---|---|
| Motivation | Bets on favorite teams, star players, and for entertainment. | Bets on numbers and undervalued lines, seeking long-term profit. |
| Analysis | Relies on media headlines, gut feelings, and recent game outcomes. | Uses statistical models, data analysis, and identifies market inefficiencies. |
| Timing | Often bets close to game time, following the crowd. | Bets early in the week to capture the best line before it moves. |
| Bet Type | Prefers favorites, overs, and parlays for high payouts. | Focuses on underdogs, unders, and straight bets where value is found. |
By learning to think like a sharp and fade the public in the right spots, you can turn crowd psychology into a profitable betting advantage. It’s about being patient, disciplined, and ready to bet against the grain when the numbers tell you to.
How to Spot Reverse Line Movement
Okay, so we've talked about fading the public. But what if there was an even louder, clearer signal that tells you exactly when the pros are piling in on the opposite side?
There is. It’s called Reverse Line Movement (RLM), and it's one of the most powerful indicators you can find. Once you learn to spot it, you'll never look at betting lines the same way again.
Reverse Line Movement is when the betting line moves in the opposite direction of where the tickets are going. Let that sink in. The vast majority of bets are on one team, but the odds for that team actually get better. It’s completely counterintuitive, which is why it’s such a massive red flag.
Think about it: if 80% of the bet tickets are on Team A at -7, the sportsbook should be making it harder to bet on them, right? They'd normally move the line to -7.5 or even -8 to discourage more action. When they move it to -6.5 instead, that tells you something big is going on. It means a huge amount of professional money sharp money is hitting Team B, forcing the book to adjust against the public tide.
Decoding the Signal of RLM
A good way to picture this is to think of the stock market. Imagine thousands of small-time retail investors are buying up a stock, but its price suddenly drops. That almost always means a few giant institutional funds are selling off massive blocks of shares.
In the betting world, the public is the mob of small investors, and the sharps are the major institutions. RLM is the market’s reaction to those huge, respected wagers from the pros.
This infographic breaks down the basic idea of using public action to find value.
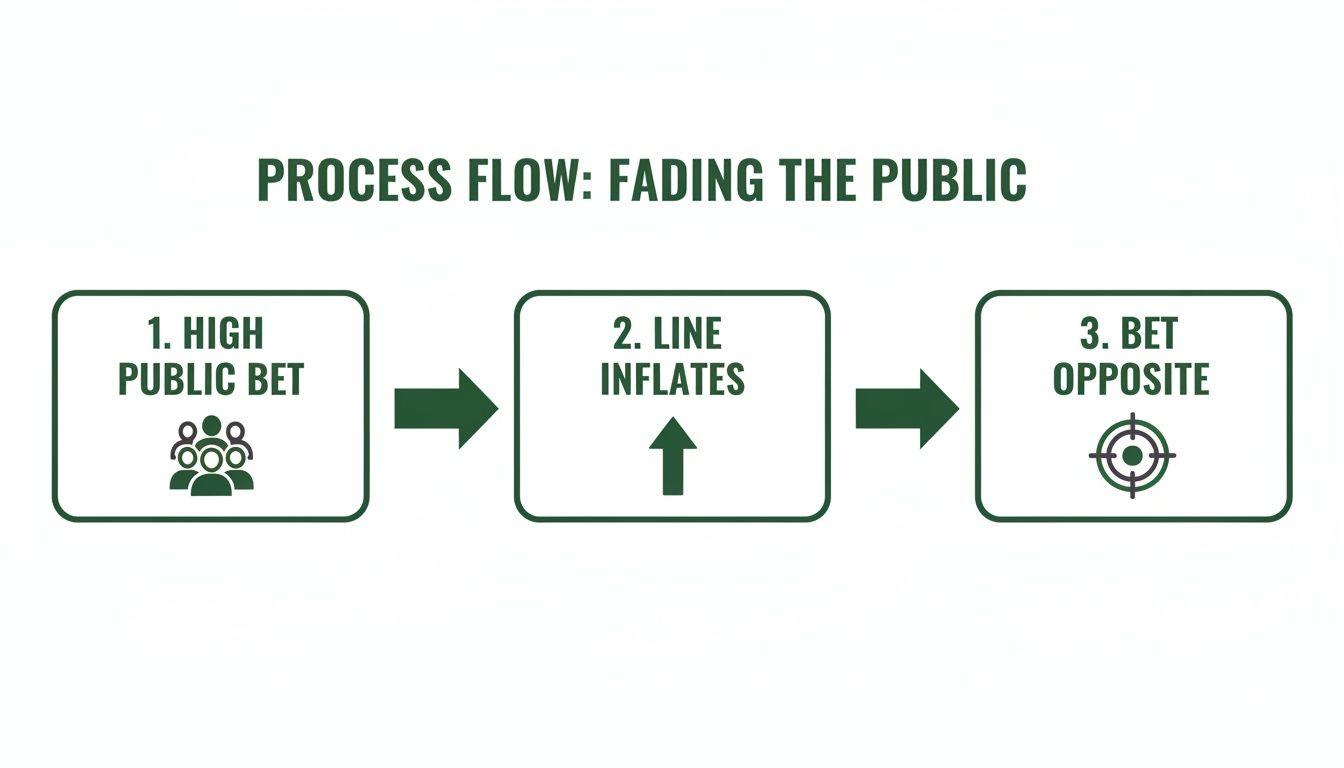
This process shows how heavy public betting can inflate a number, creating an opportunity to bet the other way. RLM is the clearest possible alert that this is happening, because the line is moving against the sheer volume of bets, not with it.
A Real-World Example of Reverse Line Movement
Let’s walk through a concrete example from a recent NBA game so you can see this in action. The Oklahoma City Thunder opened as -9.5 point favorites against the Indiana Pacers. As you’d expect, the public piled on the favored Thunder as the game got closer.
But here’s where it got interesting. Despite 68% of the spread bets coming in on Oklahoma City, the line started moving the other way. It dropped from Thunder -9.5 all the way down to -6.5. This is a textbook case of RLM.
The line moved a full three points against the public consensus. This told sharp bettors that significant, respected money was being placed on the Indiana Pacers +9.5, forcing sportsbooks to make the Thunder a less attractive bet to balance their exposure.
This is the kind of counterintuitive line shift you just can’t afford to ignore. It’s a direct message from the market that professionals people with deep pockets and sophisticated models believe the underdog has a much better shot at covering than the average fan realizes. If you want to go deeper on these market dynamics, our full guide on betting line movement is a great next step.
Why RLM Creates Such Strong Value
The real beauty of RLM is that it points you directly to value. When a line moves against the public, it's not based on a gut feeling or some talking head's opinion. It’s a direct market response to heavy, one-sided action from bettors who win over the long haul.
Here’s why this signal is so reliable:
- It confirms sharp money: You know for a fact that respected bettors are on the other side of the public.
- It creates a better number: The line movement itself gives you a better price on the contrarian side than what was originally offered.
- It filters out the noise: It helps you tune out the media hype and public narratives that are driving the majority of the bets.
When you learn to spot these key moments, you're basically riding the coattails of the pros. You’re no longer just betting against the public; you’re betting with the sharps. And that’s a much more powerful and profitable place to be.
Putting It All into Practice

Knowing what "fading the public" or "reverse line movement" means is the starting line. But the real edge comes from baking these ideas into a repeatable weekly process. This is how you stop just observing the market and start actively finding value within it.
This doesn't need to be some complicated, time-sucking ordeal. A simple, structured workflow helps you quickly flag the games with the most potential on any given day. From there, you can focus your real research on the matchups that actually matter.
A Simple Weekly Workflow
Building a routine is everything when it comes to consistently finding value. Instead of just scrolling through a sea of odds, a structured approach makes sure you never miss the critical signals that public betting percentages send out.
Here’s a basic but effective workflow you can use every week:
Spot the Big Games: First, just scan the upcoming schedule. Look for matchups with high public interest, like primetime NFL games or major college basketball rivalries. These are the games where public betting percentages are most powerful.
Get an Early Read: Early in the week, take a look at the public betting percentages for those key games. Make a note of any contest that’s already showing a heavy public lean where one side is getting 70% or more of the bets.
Watch for a Disconnect: All week long, keep an eye on how both the betting line and the percentages are moving. You're hunting for those classic value indicators, like Reverse Line Movement or a big gap between the bet percentage and the money percentage.
This manual process works, but let’s be honest it can be a serious grind. Tracking dozens of games and line moves requires constant attention, and that’s where modern tools change the game.
Let Technology Do the Heavy Lifting
Manually tracking games isn't your only option anymore. Today, specialized platforms can automate this entire process, saving you countless hours of grunt work while making sure you never miss a critical alert.
Instead of you hunting for opportunities, the opportunities can now find you. Automated tools constantly scan the market for specific conditions like lopsided public betting or reverse line movement and send you real-time notifications when these profitable scenarios pop up.
This shift from manual labor to a smarter, tech-driven strategy is a massive advantage. The explosion in global sports betting has only made this data more important. A recent massive survey showed 60% of people worldwide placed at least one sports bet in the last year, a huge jump from 35.4% in 2022. This growth fuels more skewed public betting percentages, making algorithms that scan these splits essential for finding value. You can read more about these betting market trends in TGM Research's global report.
The alert instantly flags a game where the public is piling on one side while the line moves against them, giving you all the data you need in one place. You immediately see the opportunity without spending hours digging for it yourself, boosting your efficiency whether you’re new to this or a seasoned pro.
Common Mistakes to Avoid When Using Betting Data
Using public betting percentages is a powerful tool, but it's not a crystal ball. A lot of bettors stumble right out of the gate by treating this data like some kind of magic formula instead of what it really is: one piece of a much larger puzzle.
Getting this wrong is the difference between long-term profit and a whole lot of frustration.
The Blind "Fade the Public" Trap
The most common mistake and the quickest way to drain your bankroll is blindly betting against the public on every single game. "Fading the public" is a well-known strategy, but it's just that a strategy, not a religion.
A lopsided bet percentage is a signal. It's your cue to dig deeper, not an automatic trigger to bet the other way without asking why the money is flowing the way it is.
Ignoring the "Why" Behind the Numbers
This leads us to the next critical error: completely ignoring the game's context.
Public betting data is at its most powerful when you combine it with the specific factors of that matchup. A team getting only 20% of the public bets might look like a fantastic value play on paper. But that value evaporates if you find out their star quarterback was just ruled out with a last-minute injury.
You absolutely have to consider these external variables before you even think about placing a wager:
- Injuries: Key player absences can completely flip a team's chances on their head, and they often justify why the public is piling on the other side.
- Weather: Is it going to be a blizzard? Howling wind? Extreme conditions can throw a wrench in the game plan, especially for over/under bets, making public tendencies less reliable.
- Motivation & Situational Spots: Is a team playing on short rest after a brutal overtime game? Are they in a must-win spot while their opponent has already clinched a playoff berth? Context is king.
Ignoring these elements is like trying to solve a puzzle with half the pieces missing. The percentages tell you what the market is doing, but they don't always tell you why.
Confusing Signal with Noise
Another huge mistake is failing to understand that not all games are created equal. The predictive power of public betting percentages is far stronger in high-volume markets where a ton of money is changing hands.
For a primetime NFL game, you're looking at millions of dollars in wagers. That creates a robust and meaningful dataset. In contrast, an obscure midweek college basketball game might have a tiny betting pool. A 75/25 split in that small market could just be the result of a few random bets and carries far less weight.
The goal isn't to find a system that guarantees you'll win one specific game. The real objective is to consistently identify long-term value. That takes discipline, patience, and a clear understanding that you are playing the numbers, not the teams.
This mindset helps you see past the biggest myth of all: that "the public is always wrong." They aren't. In fact, the public wins plenty of bets. The key is that they are predictably biased over the long run. Their habits chasing favorites, betting on popular teams, and loving overs create the inefficiencies that sharp bettors live to exploit.
Ultimately, you need a disciplined approach. Use the public data as your starting point for research, not your final answer. By layering in context, focusing on high-volume games, and keeping a long-term perspective, you can turn this data into a sustainable and successful betting strategy.
Frequently Asked Questions About Public Betting Percentages
To wrap things up, let's tackle some of the questions that always pop up when bettors first start digging into public betting data. This should help lock in the core ideas we've covered.
Where Can I Find Reliable Public Betting Percentages?
Finding trustworthy data is step one, and it's the most important one. Thankfully, several big-name sports media companies offer this info for free, giving you a solid foundation for your analysis.
Top sources include:
- Action Network: A go-to resource for odds, news, and public betting data across all major sports.
- VSiN, The Sports Betting Network: Offers detailed market insights and keeps a close eye on where the money is flowing.
- Covers: One of the industry's long-standing sites, providing deep stats, including bet and money splits.
While these sites are great for raw data, integrated platforms take things a step further. They don't just pull this information together; they run it through their own models to automatically flag games where the numbers look fishy, saving you all the manual grunt work.
Is Fading the Public a Guaranteed Winning Strategy?
Absolutely not. Let's be crystal clear: no betting strategy is guaranteed to win every single time. Fading the public isn't a magic button you press for one game; it's a long-term philosophy for sniffing out value.
Think of it more like a disciplined investment strategy. You're trying to capitalize on predictable market biases over hundreds of bets, not just throwing money against the grain on every popular game. Real success here demands patience, discipline, and rock-solid bankroll management.
The goal is to consistently find bets where the odds are juicier than they should be, simply because of how the public is betting. Over time, that edge can build a profit, but it will always come with its share of wins and losses along the way.
What Percentage Split Is a Strong Signal?
There isn't a single "magic number" that works every time, but there are some solid guidelines that most sharp bettors stick to. Any lopsided split is a sign that a game is worth a closer look.
As a rule of thumb, a public betting split of 70/30 is enough to raise an eyebrow and signals a strong public consensus. When that split creeps up to 75/25 or even 80/20, it becomes a very powerful indicator of a potential contrarian betting opportunity.
But and this is a big but you can't use these percentages in a vacuum. A heavy public lean is just the first clue. You always have to dig deeper and look at the line movement, injuries, and other game-specific factors before pulling the trigger.
Stop guessing and start making data-driven decisions. ValueBetFactory uses powerful algorithms to scan the market for you, sending real-time alerts when the most profitable conditions arise. Get started today at ValueBetFactory.