
Smarter Betting with a Monte Carlo Simulation Calculator
Unlock Profits with betting tips!
Let’s be honest, relying on your gut in sports betting is a fantastic way to go broke. Sure, a hot streak feels amazing, but it does absolutely nothing to prepare you for the brutal reality of variance the inevitable downswings that can completely wipe out a poorly managed bankroll.
This is exactly where a Monte Carlo simulation calculator steps in and changes the entire game for serious bettors.
Moving Beyond Guesswork in Sports Betting

A Monte Carlo simulation is a tool that runs thousands of potential scenarios based on your own betting inputs, like win probability and odds. It shows you the full spectrum of possible futures for your bankroll instead of just a single, often misleading, prediction.
Think of it less as a prediction tool and more as a financial stress test for your entire betting strategy. By embracing the natural randomness of sports, it paints a clear, data-driven picture of what could really happen over hundreds or even thousands of bets.
Why Simulation Beats Simple Prediction
A basic prediction might tell you that your strategy has a positive expected value (+EV). That’s a great start, but it leaves you blind to the questions that actually determine if you’ll survive long enough to see those profits.
- What are the real odds my bankroll will hit zero along the way?
- Just how deep could a losing streak realistically get?
- After 500 bets, what is a reasonable range of profit to expect?
A Monte Carlo simulation tackles these critical unknowns head-on. It doesn't just focus on the average outcome; it models the entire universe of possibilities, from the dream run to the worst-case drawdown that keeps you up at night. This is how you finally get a true feel for the power of variance.
Key Takeaway: The goal isn't to predict individual game winners. It's to quantify the risk and reward of your betting approach, turning the opportunities you find into a sustainable, long-term profit engine.
Turning Data into Decisions
This isn't some new-fangled concept; Monte Carlo simulations have been a cornerstone of risk assessment in finance for decades. In fact, studies analyzing U.S. market data from 1926 to 2010 found that these simulations consistently blew simpler historical models out of the water by accounting for a much wider range of potential scenarios.
For a bettor, a calculator running 10,000 trials can do the same thing for your bankroll. It projects growth, shines a light on hidden risks, and can stop you from going too heavy on a bet that looks good on the surface. You can discover more insights about how these simulations stack up against other models at McLeanam.
Ultimately, using a monte carlo simulation calculator is about building a truly robust bankroll plan. It’s the tool that helps you move from just hoping for wins to making strategic decisions backed by statistical probability, ensuring your strategy can actually withstand the pressure of both winning and losing.
Gathering the Right Data for Your Simulation

Any simulation you run is only as good as the numbers you feed into it. It’s the unbreakable rule of data analysis: garbage in, garbage out. If you want to get a meaningful picture of your potential betting future, you absolutely have to start with a realistic and carefully defined set of inputs.
These inputs are the fundamental building blocks of your entire simulation. They define your betting strategy, your perceived edge, and the financial reality you're operating within. Getting them right isn't just a step it's the most important part of the entire process.
The Five Critical Inputs
Your simulation is going to be built on five core pieces of data. Each one plays a distinct role in modeling the potential journey of your betting activity. Think of them as the DNA of your strategy.
- Estimated Win Probability: This is the percentage chance you believe your bet has of winning. Critically, this must be based on your own analysis or a trusted model, not just the bookmaker's implied probability.
- Offered Odds: Simple enough this is the decimal or American odds you’re getting from the sportsbook for the wager you're simulating.
- Stake Size: How much money are you putting on each bet? This could be a flat amount (like $10) or a percentage of your bankroll (say, 1%).
- Total Bankroll: The total pot of money you have set aside specifically for betting.
- Number of Bets: The total volume of wagers you want the simulation to run. This could be 500 or 1,000 bets to represent a full season or another specific time frame.
The act of gathering this information forces you to be honest with yourself and your strategy. It moves you from a vague idea like "I think I have an edge" to concrete numbers that can be properly tested and stress-tested.
Essential Inputs for Your Monte Carlo Simulation
To make this crystal clear, here’s a quick breakdown of what you need, why you need it, and where to find it. Think of this table as your pre-flight checklist before you run any simulation.
| Input Variable | Description | Example Value | Where to Find or How to Determine |
|---|---|---|---|
| Win Probability | Your personal assessment of the true chance a bet will win, independent of the bookie's odds. | 55% | Your own historical data, a statistical model you've built, or a trusted third-party probability source. |
| Offered Odds | The odds you are being offered by the bookmaker for your wager. | 2.00 / +100 | The sportsbook website or app where you are placing the bet. |
| Stake Size | The amount you risk on each bet. This can be a fixed amount or a percentage of your bankroll. | $25 or 1.5% | Your personal bankroll management plan. This should be a pre-defined rule you stick to. |
| Total Bankroll | The total amount of money you have dedicated solely to your betting activities. | $2,000 | Your personal financial records. Be honest and only use capital you can afford to lose. |
| Number of Bets | The total volume of bets you want to simulate to project future performance. | 1,000 | A realistic estimate of how many bets you'll place in a given period (e.g., a season, a year). |
Nailing down these five inputs is what transforms a Monte Carlo simulation from an academic exercise into a genuinely powerful tool for any serious bettor.
From Theory to Practical Application
Determining your true win probability is almost always the hardest part. If you’ve been meticulously tracking your bets, you can use your historical win rate on similar types of wagers as a solid starting point. A more advanced approach involves building your own statistical model that generates its own probabilities to compare against the market.
Your stake size should be a direct reflection of your risk tolerance and a structured bankroll management plan. Many serious bettors use a staking model like the Kelly Criterion to find that sweet spot, which mathematically balances risk and reward. Understanding the principles behind different risk assessment methods is crucial here, as it helps you set a stake that protects your capital during those inevitable downswings.
Pro Tip: Always be conservative with your inputs, especially your win probability. It's far better to underestimate your edge and be pleasantly surprised than to overestimate it and get a false sense of security. An overly optimistic simulation is genuinely more dangerous than no simulation at all.
By carefully considering and gathering these five inputs, you set the stage for a powerful simulation that can give you real, actionable insight into the potential journey of your betting strategy.
How to Run Your First Betting Simulation
Alright, this is where the theory gets real. You've got your numbers, and now it’s time to see what the Monte Carlo simulation calculator can do. We're about to peer into thousands of potential futures for your bankroll. Whether you're using a slick online tool or a spreadsheet you've cobbled together yourself, the logic behind it is refreshingly simple.
At its core, the calculator is just a digital experiment it runs over and over again at lightning speed. For every single bet in your sequence (let's say 1,000 bets), it generates a random outcome based on the win probability you fed it. If you tell it your win probability is 58%, the simulation will spit out a "win" 58% of the time and a "loss" 42% of the time over a massive sample.
With each simulated win or loss, it adjusts your bankroll according to your stake and the odds. Then, it just does it again for the next bet, and the next, until it's finished a full "season" of 1,000 bets. The real magic happens when it repeats this entire process thousands of times, creating a huge dataset of possible bankroll journeys. It’s the Law of Large Numbers playing out right on your screen.
Why More Is Always Better
Running just one or two simulations is totally pointless; the results would be pure chance. The true insight comes from running thousands of these iterations, often called trials. Think of 1,000 trials as a bare minimum starting point. Pushing it to 10,000 or more is where you really start to see a reliable picture of the outcomes, including those brutal losing streaks and euphoric heaters that define betting variance.
You don't need a Ph.D. in statistics to get this. The calculator is just rolling the dice thousands of times based on your rules. It tracks every result to give you a clear map of your strategy’s risk and reward profile.
More sophisticated simulators use advanced forecasting models, like Geometric Brownian Motion, to project bankroll fluctuations with complex formulas. While 100,000+ iterations are the gold standard in those cases, even 2,000 runs in a basic spreadsheet can tell you a ton about your tail risk.
For example, a simulation with a $5,000 bankroll, a 4% ROI, and 15% volatility might show a 75% success rate over 5,000 runs. That gives you a concrete probability to work with. If you want to geek out on the advanced math, this detailed guide is a great place to start.
The Practical Steps
Putting this into motion is much simpler than it sounds. Here’s what the process looks like in most dedicated tools:
- Plug in your data. Start by entering your five core inputs: win probability, odds, stake, bankroll, and the number of bets you want in each simulation run.
- Set your trials. Decide how many times you want the simulation to run. Again, start with at least 1,000.
- Hit the button. Click "calculate" or "run." The tool will churn through all the math in the background, usually in just a few seconds.
- Check the results. The calculator will serve up the output, typically as charts and key metrics that show the full distribution of your potential final bankrolls.
This simple process turns abstract probabilities into something you can actually see and feel. For a deeper look at how a dedicated tool makes this all a breeze, check out our guide on using a sports betting simulator. It cuts through the technical jargon and shows you how to get actionable results, fast.
Interpreting the Results of Your Simulation
Okay, you’ve plugged in your numbers and run your first simulation. Now you're staring at a mountain of data. This is where a monte carlo simulation calculator really earns its keep, turning thousands of potential futures into a clear, actionable story about your betting strategy.
The raw numbers can feel like a lot to take in at first, but making sense of them is how you turn this powerful tool into a real decision-making advantage.
The goal here isn't to fixate on a single average outcome. Instead, you’re looking to understand the entire landscape of possibilities. The simulation has just charted thousands of different paths your bankroll could take, and now it's time to read the map.
This whole process is actually pretty straightforward. You feed it the data, it runs the numbers, and you get a clear picture of the potential outcomes.
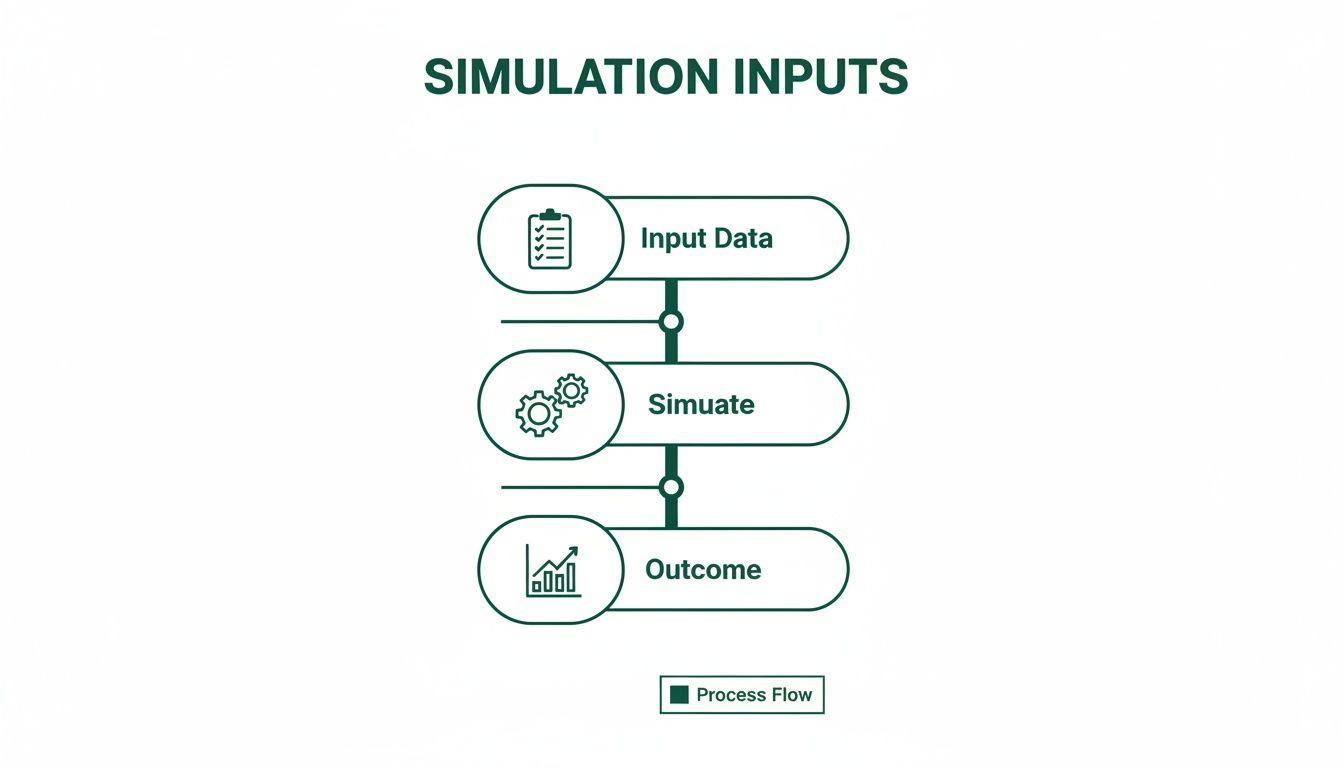
This simple flow is the engine behind the calculator's insights, giving you a visual forecast of where your strategy might lead.
Decoding Key Performance Metrics
Your simulation results will boil down to a few essential metrics. Each one tells a different piece of the story, from your expected profit to your odds of survival. Getting a handle on these is crucial for seeing the complete picture.
- Expected Value (EV): This is the average profit you can expect to make on each bet. A positive EV is the bedrock of any winning strategy, but the simulation is what shows you just how bumpy the road to realizing that value can be. You can take a deeper dive into this foundational concept with our Expected Value Calculator.
- Probability of Ruin: This is one of the most sobering and important outputs. It’s the percentage of simulations where your bankroll completely bottomed out. A high probability of ruin (anything over 5%) is a massive red flag, even if your strategy has a positive EV on paper.
- Final Bankroll Distribution: This is usually shown as a graph. It plots the final bankroll amount from every single simulation, showing you the most common outcomes as well as the extreme outliers on both ends.
Understanding the Distribution Curve
The distribution curve is your roadmap to risk and reward. It moves beyond a single number and shows you a range of percentile-based probabilities that are priceless for making high-stakes decisions.
A typical run will plot a curve where the 50th percentile shows the median outcome, while the 10th and 90th percentiles reveal the realistic "bad" and "good" scenarios.
For instance, a simulation of 500 bets with a 52.4% win rate might show that the 90th percentile outcome is a +35% bankroll growth, while the 10th percentile is a painful -18% loss. These numbers should directly inform your bankroll management rules and your mental preparation for the inevitable swings.
By focusing on these percentiles, you move beyond simple hope. You can start asking practical questions: "Am I truly comfortable with the possibility of a -18% drawdown?" This is how you start making informed choices.
Answering that question honestly is what separates a strategic bettor from a gambler. The simulation doesn't get rid of risk, but it gives you the clarity you need to manage it intelligently. It arms you with a realistic perspective on both the potential upside and the very real downside, empowering you to fine-tune your approach before a single dollar is ever on the line.
Putting Simulations to Work: Real-World Betting Scenarios
Theory is one thing, but seeing a Monte Carlo simulation calculator in action is what really makes the concept click. Let’s put all this into practice by walking through two totally different, real-world sports betting scenarios.
These case studies will show you just how wildly different outcomes can be based on your strategy and staking plan. By running the numbers, you get a front-row seat to how a simulation lets you stress-test your approach before you ever put a single dollar of your real bankroll on the line.
Case Study 1: The Disciplined Premier League Value Bettor
First, let's imagine a sharp, disciplined bettor who sticks exclusively to Premier League football. After grinding through the data and refining their model, they've found a consistent 4% value edge on their bets. They’re conservative, using a flat staking plan where they risk exactly $25 on every single wager.
Here’s what we’ll plug into the calculator:
- Bankroll: $2,000
- Stake: $25 (flat)
- Odds: 2.00 (+100) on average
- Win Probability: 52% (this gives us that 4% edge)
- Number of Bets: 500 (to represent a full season)
After running 10,000 simulations, the results paint a very clear picture. The average final bankroll lands right around $2,500, which confirms our positive expected value. But the distribution of those outcomes is where the real story is.
The 10th percentile outcome shows a final bankroll of $1,650 a painful $350 drawdown. On the flip side, the 90th percentile outcome shows an impressive final bankroll of $3,300. This proves that even with a proven edge and a safe staking plan, big swings aren't just possible; they're guaranteed. The probability of ruin, however, is less than 1%, which is fantastic.
Case Study 2: The Aggressive NBA Moneyline Bettor
Now, let's dial up the aggression. Our second bettor prefers NBA moneylines and uses a percentage-based staking plan, risking 2% of their current bankroll on each bet. This is a dynamic approach their stakes get bigger during hot streaks and shrink during cold spells.
Here are the inputs for this scenario:
- Bankroll: $2,000
- Stake: 2% of bankroll (variable)
- Odds: 2.00 (+100) on average
- Win Probability: 52% (the same 4% edge as before)
- Number of Bets: 500
Running 10,000 simulations with these new parameters spits out a much, much wider range of outcomes. The average final bankroll is actually higher, climbing to around $2,750, because the percentage staking strategy compounds winnings more effectively.
Key Insight: The aggressive strategy amplifies everything both the wins and the losses. While the potential for bigger returns is obvious, the risk of a catastrophic drawdown also skyrockets.
The 90th percentile outcome soars to a final bankroll of nearly $5,000. But the other side of that coin is much scarier. The 10th percentile outcome plummets to a final bankroll of just $1,100, a massive 45% drawdown from the starting point. The probability of ruin also jumps to over 8%, a number that most serious bettors would find completely unacceptable.
By putting these two scenarios side-by-side, the Monte Carlo simulation calculator gives us invaluable strategic insight. It shows that while the aggressive strategy has a higher average return, it comes with a terrifyingly greater risk of substantial losses. This is the exact kind of data-driven analysis that helps you align your betting strategy with your actual, personal tolerance for risk.
Common Questions About Monte Carlo Simulations in Betting
When you first start tinkering with a Monte Carlo simulation calculator, it's totally normal to have a few questions. This tool is a big leap, moving you away from fixating on single games and toward seeing the big picture of your entire strategy. Getting a feel for how it works is key to building confidence.
Let's clear the air on a few common points. This isn't about predicting who wins next Saturday. It’s a strategic lens for checking the financial health and risk of your betting approach over the long haul.
How Many Simulation Runs Are Enough for Good Results?
While there isn't one perfect number, think of 1,000 trials as your baseline. That’s usually enough for the results to settle down and give you a pretty reliable snapshot of what to expect. It's a solid starting point.
But if you really want to dig into the extremes like those rare, brutal losing streaks that can test anyone's nerve running 10,000 trials or more is even better. It all comes down to the Law of Large Numbers: the more simulations you run, the closer the average result gets to the true, underlying probabilities. Thankfully, a good calculator can chew through that many runs in a matter of seconds.
Can This Calculator Predict Who Will Win a Game?
Absolutely not, and this is the most important thing to get straight. A Monte Carlo simulation calculator does not tell you if Team A is going to beat Team B.
Its job is completely different. It's built to model the long-term financial outcome of your betting strategy, based on the numbers you feed it like your win probability and the odds. It helps you see the forest, not just a single tree, by showing what could happen over hundreds or thousands of bets.
The most common and dangerous mistake is being overly optimistic with your inputs, especially your estimated win probability. "Garbage in, garbage out" is the unbreakable rule here.
It's so easy to fall for confirmation bias and plug in a win rate that's more wishful thinking than reality. If you overestimate your edge, the simulation will spit out a beautifully positive and completely misleading forecast. This creates a false sense of security that can absolutely wreck your bankroll.
Be honest and conservative with your inputs. Base them on hard data from your betting history or a model you trust, not a gut feeling. A simulation built on realistic data is a powerful strategic tool; one based on wishful thinking is worse than useless. It's a liability.
Ready to stop guessing and start making decisions backed by data? The tools and insights at ValueBetFactory are designed to help you pinpoint value and manage your bankroll like a pro. See how a smarter approach can change your results.