
Using a Win Percentage Calculator to Win More
Unlock Profits with betting tips!
At its core, a win percentage calculator is just a tool for figuring out how often you're winning compared to how many times you've played. The basic math is dead simple: (Wins / Total Games) * 100. This gives you a clean, immediate snapshot of your success, whether you're talking about sports, betting, or any other competitive field.
Why Your Win Percentage Matters

Understanding your win percentage is about so much more than just a pat on the back. It's a fundamental metric for making smarter decisions. Whether you're a sports bettor tracking your picks, a sales manager monitoring your team, or a coach evaluating a season, this one number acts as a clear performance benchmark.
It takes a pile of raw results and boils it down to a single, powerful insight that tells you exactly how well your strategies are actually working.
This concept is used everywhere to quantify success rates. The most common formula simply divides the number of wins by the total number of attempts and multiplies by 100 to get a percentage. For instance, if a basketball team won 52 games out of 64 played, they'd have a winning percentage of 81.25%. It's a straightforward calculation, but its versatility makes it the perfect baseline for performance analysis. For a deeper look at this metric, Omni Calculator offers a great guide with more examples.
The Basic Formula and Beyond
The simplest way to calculate your win rate is with the standard formula. Let's take a football team that played 17 games, finishing with 11 wins and 6 losses.
- Formula: (Wins / Total Games) * 100
- Calculation: (11 / 17) * 100 = 64.7%
This gives us a solid, easy-to-understand measure of their season. But what happens when ties enter the picture? Just ignoring them can skew the reality of a team's performance and their ability to avoid a loss.
Incorporating Ties for Greater Accuracy
To get a more nuanced view, we can use a modified formula that treats a tie as half a win. This approach gives partial credit for not losing, which provides a much more accurate picture of performance. For bettors, understanding these small details is crucial after all, only a tiny fraction of us are consistently profitable. You can learn more about what percentage of sports bettors are profitable in our guide.
Let’s look at another team's season. This time, their record is 10 wins, 5 losses, and 2 ties across the same 17 games.
- Formula with Ties: ((Wins + (0.5 * Ties)) / Total Games) * 100
- Calculation: ((10 + (0.5 * 2)) / 17) * 100
- Result: (11 / 17) * 100 = 64.7%
By accounting for ties, we get a truer reflection of this team's performance. It acknowledges that avoiding a loss, even without securing a win, is a positive outcome that deserves to be factored into the final percentage.
This simple adjustment transforms the win percentage from a basic stat into a more powerful analytical tool. It builds the foundation for making smarter, more informed strategic decisions based on a complete performance picture.
For a quick summary, here's a simple table to help you decide which formula to use.
Win Percentage Formulas at a Glance
| Formula Type | Calculation | Best Used For |
|---|---|---|
| Standard Win % | (Wins / Total Games) * 100 | Competitions where ties are not possible or are counted as a distinct outcome with no value (e.g., basketball, knockout tournaments). |
| Win % with Ties | ((Wins + (0.5 * Ties)) / Total Games) * 100 | Sports or scenarios where ties are a common result and avoiding a loss has inherent value (e.g., football, hockey regular season). |
Choosing the right formula really just depends on the context of what you're measuring. Both are useful, but knowing when to include ties gives your analysis an extra layer of accuracy that can make all the difference.
Calculating Your Win Rate in Sports Betting
Alright, let's move from theory to the real world and apply the win percentage concept to your betting history. This isn't just a math exercise; it's about digging into your own data to find a genuine edge. Calculating your personal win rate is the first step in leveling up your betting from a casual hobby to a disciplined, data-driven strategy.
Let's say you placed 50 bets on the NFL last month and won 28 of them. The basic formula tells us your win rate is a solid 56% (28 wins / 50 total bets). In the sports betting world, a 56% win rate is fantastic and can be seriously profitable, but that number is only half the story. Its true value hinges entirely on the odds you were taking.
Finding Your Break-Even Point
Here's where your win rate gets incredibly useful: it helps you find your break-even point. This is the absolute minimum percentage of bets you need to win just to keep your head above water and not lose money. It's not one-size-fits-all; it's tied directly to the average odds of your bets.
For standard -110 odds wagers the kind you see everywhere on point spreads and totals the magic number is 52.38%. So, if you're hitting at 56%, you're not just breaking even; you're comfortably in the green.
But things change fast if you're a fan of betting on underdogs. If you're consistently taking longer odds, the win rate you need to stay profitable drops dramatically. Take a look:
- -110 Odds: You need to win 52.38% of your bets.
- +150 Odds: You only need to win 40.00% to break even.
- +200 Odds: Now you only need a 33.33% win rate.
This shows why a "good" win rate is meaningless without context. A bettor who wins 45% of their underdog moneyline bets could be crushing it, while someone hitting 54% on standard spreads might barely be making a profit.
Why Meticulous Tracking Is Non-Negotiable
You can't calculate what you don't track. It's that simple. If you want to find your true win rate and identify your break-even point, you have to log every single bet you make. This data is the bedrock of any serious betting strategy.
Your betting history is a goldmine of insights. It tells you which sports you excel in, which bet types are your most profitable, and where your blind spots are. Without this data, you're essentially flying blind, relying on gut feelings and biased memory.
Jotting down bets in a notebook is better than nothing, but a proper spreadsheet is a game-changer. For anyone looking to get serious, a well-organized bet tracker spreadsheet can automate these calculations and shine a light on trends you'd never spot otherwise. This is what separates casual bettors from the sharps.
Once you have your data tracked, you can start slicing it up to find your win percentage in different areas. You might discover some interesting patterns:
- You're hitting 61% on NBA totals.
- Your NFL moneyline picks are only winning 48% of the time.
- Your college football spread bets are cashing at a 55% clip.
This is where the real power is. This segmented data tells you to double down on your strengths (like NBA totals) and maybe rethink your approach to the weaker spots. Calculating your win rate isn't just about finding one number; it's about starting a cycle of constant improvement, all backed by cold, hard evidence from your own betting habits.
Making Smarter Bets with a Calculator

Sure, you can punch numbers into your phone's calculator or scribble them on a notepad, but using a dedicated online win percentage calculator is a massive step up. It's not just about avoiding simple math errors it's about freeing up your time to focus on what actually makes you money: finding good bets and sharpening your strategy.
Tools like the ones we've built at ValueBetFactory are designed to be dead simple. You just pop in your total wins and losses (and ties, if you have them), and it instantly spits out your win percentage. No spreadsheets, no formulas, no fuss.
This kind of immediate feedback is incredibly powerful. You can quickly get a snapshot of your performance without getting bogged down in the manual work, which makes it much easier to stay on top of your results.
Interpreting the Results for Value Betting
Getting that percentage is step one. The real skill is knowing what to do with it. This is where a simple calculator becomes a core part of your value betting toolkit. It lets you move past a single, generic win rate and start slicing up your data to see where you’re genuinely sharp and where you’re leaking money.
Let's say you've tracked your last 100 NBA bets. Your overall win rate is 54%. That’s not bad, but it doesn't tell the whole story. By breaking it down, you might find something like this:
- Over/Under Bets: You’ve hit a stellar 62% across 40 bets.
- Player Prop Bets: You’re struggling, hitting just 48% on 30 bets.
- Moneyline Bets: You’re hovering around 53% on the other 30.
This is where the lightbulb goes off. This segmented data tells you your feel for game totals is your bread and butter, and it’s a clear signal to focus more of your energy and bankroll there. On the flip side, that 48% on player props is a flashing red light telling you to either fix your approach or stop betting them altogether.
This level of insight is fundamental to smart bankroll management. When you know your most profitable niches, you can confidently allocate more capital to the areas where you have a proven edge, which is how you drive long-term growth.
This turns the calculator from a basic math tool into a strategic weapon. It helps you pinpoint real market value by showing you where your analysis is consistently beating the odds. For bettors who want to take this even further, pairing this analysis with an expected value calculator can add another powerful layer to your decision-making process.
Integrating the Calculator into Your Workflow
To get the most out of this, you need to make it a habit. Don't just calculate your win rate once in a blue moon. Think of it as a constant feedback loop.
Run the numbers after every 20 or 30 bets. Is your hot streak in Over/Unders holding up? Have you managed to improve your performance on player props?
This regular check-in forces you to be honest with yourself and refine your strategy based on hard data, not just gut feelings. It keeps you accountable, confirms where your strengths lie, and helps you make smarter, more informed bets backed by your own track record.
It turns out, the power of win rate analysis goes way beyond the world of sports betting. In business, this exact same metric is an essential tool for figuring out what's working, fine-tuning your strategy, and actually driving growth. Here, a "win" is a closed deal, and the "game" is any sales opportunity.
This is what's known in the industry as the sales win rate, and it measures the simple ratio of deals you've won against the total number of opportunities your team went after. It’s probably the most direct indicator you have of how effective your sales team really is. By calculating this one core metric, a company can finally stop relying on gut feelings and start looking at a data-backed picture of its performance.
Drilling Down for Deeper Insights
A company's overall win rate gives you a great 30,000-foot view, but the real magic happens when you start segmenting the data. Instead of just staring at the big picture, you can use a win percentage calculator to zoom in on specific parts of your business. This is where you unearth the kind of intelligence you can actually act on.
Let's imagine a software company with two totally different sales teams:
- Enterprise Team: They're focused on landing the big fish large corporate clients with long, complex sales cycles.
- Mid-Market Team: Their world is selling to small and medium-sized businesses, which usually involves a quicker turnaround.
By calculating the win rate for each team separately, the sales director might discover a massive performance gap. This kind of analysis pinpoints exactly where the sales process is firing on all cylinders and where it might need more support or a completely different approach.
Using Data to Steer Your Sales Strategy
These metrics are so important in sales analytics because they give you a direct, unfiltered look at your team's ability to convert. A segment-based analysis makes this understanding even sharper. For instance, the enterprise sales team might close 2 out of 12 major opportunities, giving them a 16.6% win rate. Meanwhile, the mid-market team could be converting 10 out of 27 leads for a much healthier 37% win rate. As you can find out from in-depth research on win-loss analysis, these kinds of differing rates tell you precisely where your sales strategies might need a tune-up.
A low win rate isn't necessarily a sign of failure; it's a diagnostic tool. It forces you to ask the right questions: Is our pricing model wrong for the enterprise market? Does our product lack a key feature that larger clients demand? Does the team need better training to handle these more complex sales cycles?
This same logic works perfectly for product lines, too. If Product A has a solid 40% win rate but Product B is sputtering along at 15%, it tells you exactly which product is connecting with customers and where your marketing and development resources should probably be focused.
At the end of the day, using a win percentage calculator in your business turns raw sales data into a strategic roadmap. It helps you identify your top performers (whether they're people or products), diagnose the weak spots in your sales funnel, and make informed decisions that lead to real, measurable growth. It's all about replacing guesswork with clarity.
Predicting Success with Advanced Win Scoring
When a massive business deal is on the line, your simple win/loss record doesn't tell you much. It’s a backward-looking metric that’s great for seeing where you've been, but it offers almost no predictive power for the complex opportunities you’re chasing right now. This is where a smarter approach comes in, one that moves beyond a basic win percentage calculator to a genuinely predictive model.
Instead of just tallying up past wins and losses, this method introduces a Probability of Win (PWin) score. Think of it as a forward-looking metric that sizes up your chances of winning a specific, future opportunity by weighing a whole range of critical factors.
The Anatomy of a PWin Score
A PWin score isn't some number pulled out of thin air. It’s the result of a weighted calculation that blends several different variables, each carrying a different level of importance. This data-driven approach is designed to pull emotion and gut feelings out of the decision-making process.
Advanced win percentage models use these weighted factors to get a real read on the likelihood of success, especially in hyper-competitive sales environments. The PWin score is a perfect example, often built from components like customer fit (25%), competitive edge (15%), past performance (20%), customer relationship (30%), and pricing (10%).
Let’s walk through a quick example. Imagine you’re bidding on a big project and you rate your position like this: a 9/10 for customer fit, a 7/10 for competitive edge, an 8/10 for past performance, a 6/10 for your relationship, and a 5/10 on pricing.
Plugging those numbers into the weighted model gives you a PWin score of 7.2 out of 10, or a 72% probability of winning the deal. You can learn more about these PWin calculations and how they're used to get a tactical edge.
Here’s a look at how that calculation breaks down in a table format.
Sample PWin Score Calculation
| Factor | Weight (%) | Score (1-10) | Weighted Score |
|---|---|---|---|
| Customer Relationship | 30% | 6 | 1.8 |
| Customer Fit | 25% | 9 | 2.25 |
| Past Performance | 20% | 8 | 1.6 |
| Competitive Edge | 15% | 7 | 1.05 |
| Pricing | 10% | 5 | 0.5 |
| Total PWin Score | 100% | 7.2 |
This kind of weighted model gives you a much more honest picture of your chances. It acknowledges that some things like a rock-solid customer relationship often carry more weight than pricing alone.
By assigning different weights, the PWin model accurately reflects that some factors, like the strength of a customer relationship, are often more influential than others, like pricing alone. This creates a much more realistic and nuanced prediction.
This bar chart compares the sales win rates between enterprise and mid-market teams, showing a clear performance difference.
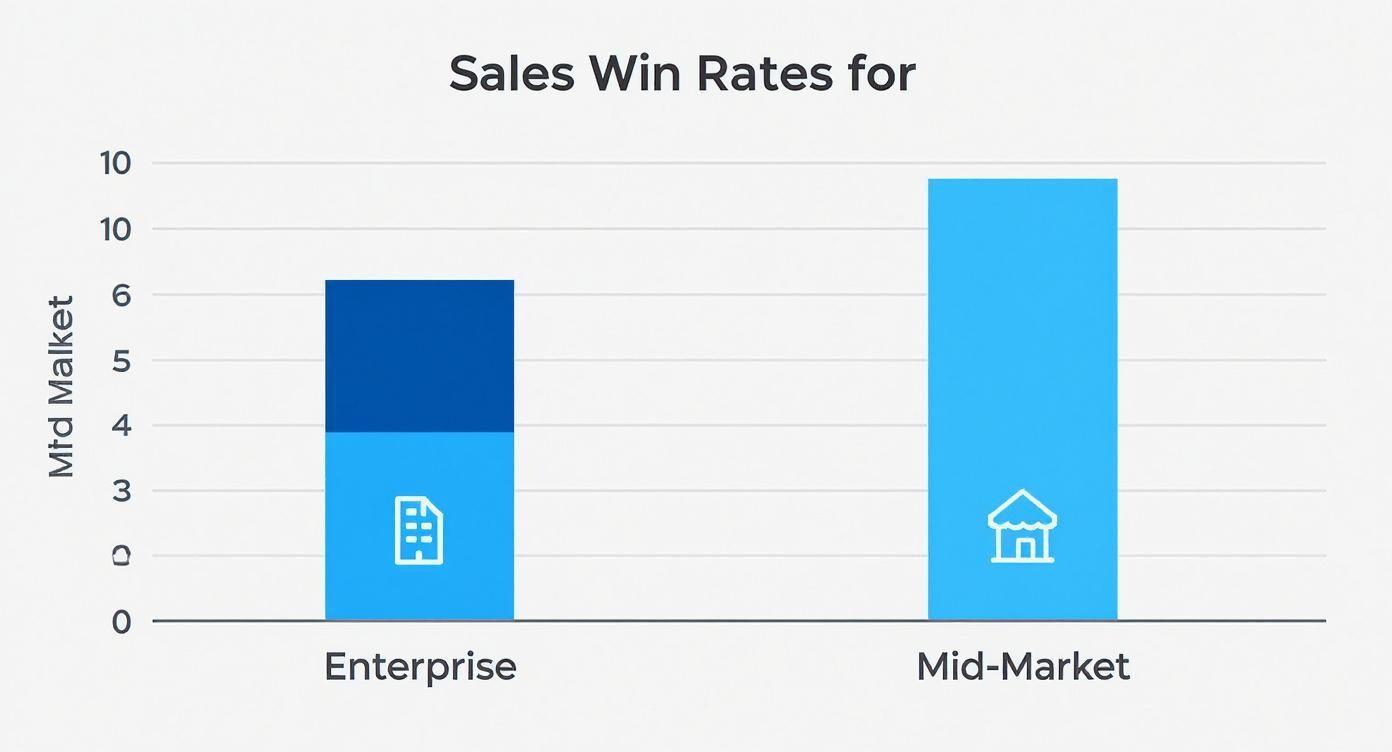
The chart drives home the point that mid-market sales teams often see a higher win rate. This is typically because they're dealing with shorter, less complex sales cycles compared to the long, multi-stakeholder deals common in the enterprise space.
Making Go/No-Go Decisions
At the end of the day, the PWin score has one primary job: helping leaders make smarter decisions about where to spend their resources. It delivers a clear, objective number that cuts through the noise and guides those critical "go/no-go" choices on major bids.
A high PWin score, say anything over 70%, is a green light. It signals a strong opportunity that deserves your A-team and your full attention. On the other hand, a score dipping below 40% is a massive red flag. It forces you to hit pause and ask the hard questions: Is this deal really winnable, or would our time, money, and energy be better spent elsewhere?
This kind of predictive scoring shifts your sales strategy from reactive to proactive, ensuring your team is always focused on the deals they actually have the highest probability of closing.
Common Questions About Win Percentage
Even with the right calculator in hand, a few questions always pop up when you start digging into the numbers. Let's tackle some of the most common ones to make sure you're applying these concepts like a pro.
How Do Ties Affect My Win Percentage?
This is a great question. Ties, or draws, can feel like they throw a wrench in the works, but there's a standard way to handle them that gives you a much more accurate picture of performance. The best practice is to count a tie as half a win.
After all, avoiding a loss still has value. The formula simply adjusts to: (Wins + 0.5 * Ties) / Total Games.
Let's say a team has a record of 10 wins, 5 losses, and 5 ties over 20 games. Using the proper formula, their win percentage is a solid 62.5%. If you just ignored the ties and only counted wins and losses, their win rate would look like a misleading 50%, failing to capture their true resilience.
What Is a Good Win Percentage for Sports Betting?
This is the million-dollar question, but the answer isn't a single magic number. A "good" win rate in sports betting is completely tied to the odds you're betting on. You could be wildly profitable with a 35% win rate or go broke with a 55% win rate.
It all boils down to your break-even point.
For those standard point spread bets at -110 odds, you have to win 52.4% of the time just to cover the sportsbook's commission and break even. This means any consistent win rate north of 53% is considered strong and genuinely profitable.
But if you're a specialist who hunts for value in underdog moneylines at much longer odds, the bar is set much lower.
- -110 Odds: Your break-even point is 52.4%.
- +200 Odds: You only need to win 33.3% of the time.
- +300 Odds: The break-even drops to just 25.0%.
The real goal isn't chasing some arbitrary percentage. It's about consistently beating the break-even point for the odds you typically bet. A win percentage calculator is your best tool for seeing if you're actually clearing that hurdle.
How Can I Actually Improve My Win Rate?
Improving your win rate isn't about getting lucky; it's an active process that starts and ends with good data. It’s all about strategy and constant refinement.
The first step is non-negotiable: you have to track every single bet you make. No exceptions. Once you have a reliable set of data, you can start slicing it up to find patterns and real, actionable insights.
For instance, you can analyze your betting performance by breaking it down into different variables:
- By Sport: Are you a genius when it comes to the NFL but a disaster with the NBA?
- By Bet Type: Do you crush moneylines but consistently get burned by player props?
- By Team: Do you have a hometown bias for a team that’s secretly costing you a fortune?
This kind of analysis will shine a bright light on your strengths and weaknesses. From there, the path forward is clear: focus your time, energy, and bankroll on the areas where you have a proven edge, and either work to fix or simply avoid the spots where you consistently underperform.
Ready to stop guessing and start making data-driven decisions? The tools at ValueBetFactory are built to help you find and sharpen your edge. From our advanced calculators to real-time value bet alerts, we give you everything you need to bet smarter. Explore our platform today and see how data can transform your betting strategy.