
A Guide to Finding Profitable MLB Prop Bets
Unlock Profits with betting tips!
Winning at MLB prop betting isn't about luck or having some magic gut feeling. It's about finding a quantifiable, data-driven edge and exploiting it. This guide is your framework for doing just that-moving past basic wagers to pinpoint profitable bets by digging into the niche stats where sportsbooks are often weakest.
Finding Your Edge in MLB Prop Betting

Most bettors stick to the main markets like the moneyline or run line. The problem? Those lines are incredibly sharp. Oddsmakers have poured massive resources into making them nearly perfect. The real opportunity, however, is often hiding in plain sight: MLB prop bets. These wagers on individual player or game outcomes are where a sharp eye for data can uncover some serious value.
Unlike betting on a team to win, props let you zero in on specific matchups. Think of it as a series of smaller, more predictable battles happening within the larger game. You might analyze a pitcher's strikeout potential against a lineup that swings and misses a ton, or a power hitter's chances of launching a homer against a pitcher who hangs his curveball.
Why Props Offer a Unique Advantage
The core of this strategy comes down to a simple truth: sportsbooks can't be experts on everything. While their main lines are razor-sharp, they have far less precise data for the hundreds of individual prop markets they offer every day. This creates small pockets of inefficiency that a prepared bettor can jump on.
This is where you can find a real edge:
- Pitcher Performance: Forget ERA. Dig into advanced metrics like strikeout percentage (K%) and called + swinging strike rate (CSW%). These give you a much clearer picture of a pitcher's true dominance.
- Hitter Matchups: Don't just look at batting average. Examine how a batter performs against specific pitch types or a pitcher's handedness. These splits can reveal huge, hidden advantages.
- External Factors: Things like ballpark dimensions, weather conditions, and even the home plate umpire's strike zone tendencies all play a massive role that is often undervalued by the market.
The goal isn't just to pick winners. It's to consistently find wagers where the odds offered are better than the true probability of that event happening. This is the entire foundation of positive expected value (+EV) betting.
By digging into these niche stats, you stop guessing and start making informed, data-backed decisions. It's the difference between gambling and investing. To really make this stick, you have to get comfortable with the core ideas behind spotting mispriced odds. I highly recommend taking some time to learn more about the principles of value betting if you haven't already. That strategic mindset is what separates casual fans from profitable sports bettors in the long run.
Understanding the Prop Betting Landscape
To consistently find valuable MLB prop bets, you first need a detailed map of the territory. The prop market isn't just one big, chaotic mess; it's more like a sprawling city with distinct neighborhoods. Each one has its own rules, rhythms, and opportunities.
Figuring out these different areas is the first real step toward moving from casual guessing to calculated analysis.
Broadly speaking, the market is split into two main categories: pitcher props and hitter props. That might sound simple, but the depth within each is immense. Sportsbooks don't just pull these numbers out of thin air; they use complex models to set their lines. Your job is to find the cracks in those models.
Deconstructing Pitcher Props
For data-driven bettors, pitcher props are usually the first port of call, and for good reason. A pitcher's performance is a relatively isolated event, making it easier to project with a high degree of accuracy if you know what signals to look for.
The most common markets you'll encounter are:
- Strikeouts (K's): This is the king of pitcher props. A book might set a line at 6.5 strikeouts, and you simply bet over or under. Real success here means looking beyond a pitcher's season-long K/9 rate and digging into things like the opponent's strikeout percentage (K%) against that pitcher's handedness.
- Outs Recorded: This is a fantastic market for analyzing a pitcher's efficiency and durability. Instead of just betting on a win, this prop lets you wager on exactly how deep they'll go into a game. A common line is 17.5 outs, which is just shy of six full innings.
- Earned Runs Allowed: Here, you're tasked with predicting how many runs a pitcher will surrender. This is heavily influenced by the opposing lineup's strength, recent performance, and even the weather-windy conditions can easily turn routine fly balls into home runs.
A key insight here is that a pitcher's strikeout prop isn't just about their raw talent. It's a complex equation involving the opposing lineup's plate discipline, the home plate umpire's tendencies, and even atmospheric conditions. A pitcher-friendly ump can easily add an extra strikeout or two to their total.
By dissecting these variables, you can start to see where a sportsbook's line might be slightly off. Maybe they haven't fully accounted for an umpire's tight strike zone or a lineup's recent struggles against sliders, which just so happens to be the pitcher's best pitch.
Uncovering Opportunities in Hitter Props
While pitcher props often get the spotlight, ignoring hitter props is just leaving money on the table. These markets require a different analytical lens, one that focuses more on individual batter-pitcher matchups, platoon advantages, and specific park factors.
Popular hitter props to explore include:
- Total Bases: This is a great alternative to just betting on a player to get a hit. A single is one base, a double is two, a triple is three, and a home run is four. You'll often see a line like Over 1.5 total bases for established power hitters.
- Hits, Runs, and RBIs: You can bet on a player to record a hit, score a run, or drive one in. These are often bundled into a single "H/R/RBI" prop.
- Home Runs: The ultimate high-risk, high-reward prop. Betting on a player to go yard offers long odds and requires a deep understanding of power metrics and ballpark effects.
Analyzing these markets means you're no longer just betting on teams but on specific, predictable interactions within the game. For example, public betting trends often show a strong preference for moneyline favorites. In a recent MLB regular season, the public's record on moneyline wagers was an impressive 1,484 wins to 951 losses. But this broad trend often overlooks the nuanced player-level matchups that really drive prop bets. You can explore more about these public betting trends and market dynamics to see how props offer a different angle.
Exploring Niche Prop Markets
Beyond the standard player props, there are some incredibly valuable niche markets that savvy bettors love to exploit.
One of the most popular is the No Run First Inning (NRFI) or Yes Run First Inning (YRFI) bet. It's a simple wager on whether a run will be scored in the opening frame. This market is fantastic because you're only analyzing a small, focused slice of the game: the top of each lineup against the starting pitchers. This is where you can find a huge edge by identifying dominant aces facing weak top-of-the-order bats.
How to Analyze Pitcher Prop Bets
When it comes to finding a real, data-driven edge in MLB betting, pitcher props are where the action is. Strikeouts, in particular, are a fantastic market because they let you zero in on a one-on-one battle, isolating a pitcher's raw ability against a specific lineup.
To win here, you have to throw out the old-school stats. Forget about ERA and pitcher wins; they're noisy and often misleading. The key is to dig into the predictive metrics that give you a much clearer picture of a pitcher's true talent and future performance.
Going Beyond the Basics with Predictive Stats
The first step is shifting your focus to the right set of numbers. A pitcher's total strikeout count for the season is nice, but it doesn't really tell you how dominant he is on a per-batter basis. That's what we need to know.
These are the metrics that should be at the core of your analysis:
- Strikeout Percentage (K%): This is your bread and butter for strikeout props. It tells you the exact percentage of batters a pitcher faces that end in a K. Unlike K/9, it isn't warped by pitchers who let a lot of guys reach base. Any pitcher rocking a K% of 28% or higher is operating at an elite level.
- Called + Swinging Strike Rate (CSW%): This stat is a fantastic indicator of a pitcher's pure stuff. It simply adds up all the called strikes and swinging strikes (whiffs) and divides by the total pitches thrown. A CSW% over 30% signals a pitcher who can consistently get ahead of hitters and control at-bats.
- Skill-Interactive ERA (SIERA): While not a direct strikeout metric, SIERA is a phenomenal tool for gauging a pitcher's real skill level. It strips away the luck and defensive factors, focusing only on what the pitcher can control: strikeouts, walks, and ground balls. It’s perfect for spotting guys who are due for a correction, which can be gold for props like Outs Recorded or Earned Runs.
These numbers cut right through the noise. If you're looking to get deeper into this style of handicapping, our guide on general betting on baseball strategies provides a great foundation.
The Crucial Role of Matchups and Opponents
Even a Cy Young contender can get roughed up by a disciplined lineup, just as an average arm can look like an ace against a team that swings at everything. The matchup is every bit as important as the pitcher himself.
You need to get granular with the opposing team's tendencies. Look up their team K% specifically against the pitcher's handedness (righty vs. lefty). A lineup that strikes out 25% of the time against right-handed pitching is a prime target for a high-K% righty. The variance between an ace who averages over 9 strikeouts per 9 innings and a back-of-the-rotation guy hovering around 6-7 K/9 is where you find your edge.
Data platforms like EV Analytics are invaluable for this kind of research, breaking down K-rates against both righties and lefties.
Don't Overlook the External Factors
A perfect statistical matchup can fall apart if you ignore the outside variables. Two of the biggest culprits that can sink an otherwise sharp bet are the umpire and the ballpark.
A pitcher-friendly umpire is a hidden asset for strikeout props. Some umps have a notoriously wide or tall strike zone, leading to more called strikes and putting hitters in a defensive position.
There are several great resources online that track umpire stats. A quick look at the home plate ump's historical called-strike rate can either give your bet a green light or wave you off a potential landmine.
The ballpark itself also has a massive impact, especially on props like earned runs or total outs.
Park Factor Considerations
| Park Type | Impact on Pitcher Props | Example Scenario |
|---|---|---|
| Pitcher's Park | Large outfields and dense air can suppress home runs and extra-base hits. | A fly-ball pitcher is more likely to succeed at Oracle Park (San Francisco). |
| Hitter's Park | Thin air (like in Colorado) or short fences can turn routine fly balls into home runs, inflating earned run totals. | An over on a pitcher's Earned Runs prop is more viable at Great American Ball Park. |
| Foul Territory | Parks with large foul territories (like in Oakland) give pitchers more chances for easy outs on pop-ups, helping their pitch count. | This can be a sneaky edge for an Over on an Outs Recorded prop. |
By layering advanced pitcher stats, deep matchup analysis, and these key external factors, you build a comprehensive case for your MLB prop bets. This systematic process is what separates educated betting from simple guesswork.
Finding Value in Hitter Prop Bets
While pitcher props get a lot of the spotlight, some of the best value day-in and day-out is hiding in the hitter prop markets. Digging into a hitter's potential is a totally different ballgame than analyzing pitchers; it’s less about one guy’s dominance and more about the specific, explosive potential in a single matchup.
The key to cashing these MLB prop bets is to stop looking at outdated stats like batting average and start focusing on the metrics that truly measure a hitter’s skill and raw power. If you build a repeatable process, you can consistently spot hitters who are on the verge of a monster game.
Advanced Metrics for Hitter Analysis
To get a real feel for what a hitter can do, you need to be looking at the right numbers. Modern analytics paint a far more accurate picture of performance than the traditional stats ever could. If you're serious about finding an edge, making these stats a core part of your process isn't optional.
Start by zeroing in on these heavy hitters:
- Weighted On-Base Average (wOBA): Think of this as on-base percentage on steroids. It gives a specific weight to every possible outcome-a walk, a single, a double, etc.-rolling it all into one number that captures a player's total offensive value. A wOBA of .340 is solid, but guys sitting above .370 are truly elite.
- Isolated Power (ISO): This metric cuts right to the chase and tells you how much raw power a hitter has. By subtracting batting average from slugging percentage, it isolates a player's ability to hit for extra bases. An ISO north of .200 signals serious pop, making it a go-to stat for total bases or home run props.
- Barrel Rate (Brl%): A "barrel" is a Statcast term for a ball hit at the perfect combination of exit velocity and launch angle-the sweet spot that produces doubles and home runs. A high barrel rate (anything over 10%) is a huge indicator that a hitter is consistently making the best possible contact.
These advanced stats help you see past the noise and identify hitters who are actually performing much better than their basic box score numbers might suggest.
Dissecting the Pitcher vs Batter Matchup
The real meat of handicapping hitter props is in the matchup. Even the league's best sluggers have pitchers they hate to face, and some mediocre arms just happen to have a hitter's number. Your job is to find those beautiful intersections where a hitter's strengths line up perfectly with a pitcher's biggest weakness.
It all starts with the platoon advantage. This is batting 101: most right-handed hitters mash left-handed pitching, and vice versa. Finding a righty with a .901 OPS against southpaws who happens to be facing one is often a green light.
But you have to go deeper than just handedness. The real gold is in the pitch-type splits. Does a batter absolutely crush fastballs? You need to know how often the opposing pitcher throws one. If a pitcher leans on his four-seamer 60% of the time and the hitter you're eyeing has a .450 wOBA against that specific pitch, you’ve just found a massive edge.
The real edge is found in the specifics. A hitter might struggle against curveballs in general but crush them when they are left hanging up in the zone. This level of detail is where profit is made.
The Overlooked Impact of Ballpark Factors
Where the game is played has a massive impact on a hitter's output. Ballpark factors can be the difference between a routine fly ball and a souvenir for the bleachers. Forgetting to check the park is one of the quickest ways to watch a well-researched bet go down in flames.
Everyone knows some parks are just plain friendly to hitters, either because of their dimensions or the altitude.
Key Ballpark Considerations
| Park | Key Characteristic | Impact on Hitter Props |
|---|---|---|
| Coors Field | High altitude makes the air thin, allowing batted balls to travel farther. | Increases the likelihood of home runs and extra-base hits. |
| Great American Ball Park | Short fences in the corners and a compact outfield. | A prime location for targeting home run and total bases props. |
| Oracle Park | Deep right-center field and dense, heavy air from the bay. | Suppresses power, especially for right-handed hitters. |
Always check a park's specific factors before locking in a bet. A hitter with monster power numbers might be a terrible bet for a home run prop if he’s playing in a pitcher's paradise like Oracle Park. It's the combination of advanced metrics, deep matchup analysis, and these environmental factors that creates a rock-solid process for finding profitable hitter props.
Using Tools and Models to Sharpen Your Edge
If you want to consistently win at MLB prop bets, you eventually have to move past pure manual analysis. It’s a great way to start, but to build a real, sustainable edge, you need to adopt a more systematic, tool-driven approach. This is how the pros do it. It means getting comfortable with odds comparison tools, tracking line movement, and maybe even building your own simple projection models.
This is the transition that separates the casual handicapper from the systematic bettor. It’s where long-term profitability is really forged, creating a process that’s repeatable, scalable, and a lot less vulnerable to emotional decisions.
Leveraging Historical Odds and Line Movement
One of the most powerful ideas in sports betting is Closing Line Value (CLV). In simple terms, CLV just measures whether you got a better price than the final, closing odds. If you bet a player over 6.5 strikeouts at -110 and the line closes at -135, you’ve grabbed positive CLV. It’s a mathematical sign that your analysis was ahead of the market.
To track this, you need access to historical odds data. Since May 2023, detailed historical odds for various MLB markets have been tracked with updates every five minutes, giving us a high-resolution look at how betting lines move. The data shows a clear trend: bettors who consistently beat the closing odds in prop markets have historically seen positive returns. You can discover more insights about historical odds data on The-Odds-API.com to see how it allows you to backtest entire betting systems.
The whole point is simple: if you're regularly beating the closing line, you're spotting value before the rest of the market catches on. Over a large sample size, positive CLV is one of the strongest indicators of a winning bettor.
Building a Simple Projection Model
You don't need a PhD in statistics to build a basic model that gives you an edge. Seriously, a simple spreadsheet is all it takes to create your own projection system, which you can then compare against the lines the sportsbooks are offering. This whole process pulls back the curtain on odds-making and helps you put a real number on your perceived advantage.
This flow chart breaks down the core components that go into analyzing a hitter prop, blending a player's raw skill with the external factors of the game.
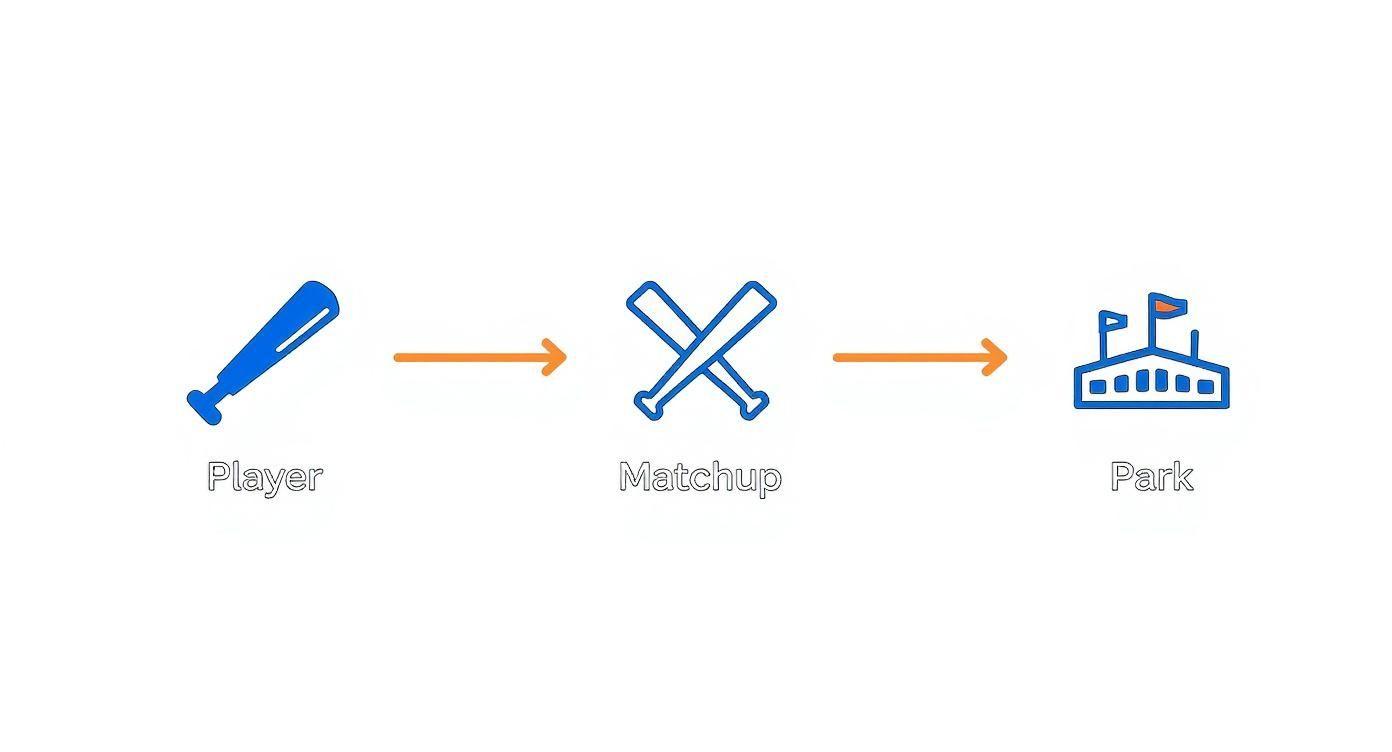
This process shows how a sharp bettor has to synthesize data from the player’s skills, the specific matchup, and even the park environment to form a complete picture.
Here’s a simplified process for a pitcher strikeout model:
- Establish a Baseline: Start with the pitcher's K% and the opposing lineup's K% against that pitcher's handedness.
- Make Adjustments: Factor in the external variables. For instance, you might nudge the projection up a bit for a pitcher-friendly umpire or dial it back if the pitcher has a terrible history against a few key hitters.
- Project the Outcome: Use these adjusted rates to project the total strikeouts over an estimated number of batters faced.
- Convert to Odds: Turn your projection into a probability and then into an American odds line. If your model spits out a 55% chance of an outcome, that translates to true odds of -122.
- Compare and Bet: If the sportsbook is offering -110 on something your model prices at -122, you've just found a value bet.
This is a foundational approach, but it’s incredibly effective. For anyone interested in taking the next step, you can learn more about how to build a sports betting model with our in-depth guide.
Essential Tools for the Modern Bettor
Several tools can make this entire process way more efficient and accurate. You don’t need to subscribe to a dozen different services, but having a few key resources in your arsenal is critical for success.
Your toolkit should include:
- Odds Comparison Site: This is completely non-negotiable. It scans multiple sportsbooks to make sure you get the absolute best price on every single wager. Getting -105 instead of -115 might not feel like a big deal, but it has a massive impact on your long-term ROI.
- Advanced Stat Database: Sites like FanGraphs and Baseball Savant are your go-to sources for the predictive metrics we’ve talked about, from wOBA and ISO to K% and CSW%.
- Alert Services: These tools can shoot you a notification when a line moves a certain amount or when a sportsbook posts an opener that looks way out of place. This lets you act quickly before the value is gone.
By combining your own analysis with these powerful tools, you create a robust system for identifying and attacking mispriced MLB prop bets. This systematic approach is what separates casual weekend betting from a disciplined, profitable strategy.
Common Questions About Betting MLB Props
When you start digging into the data behind MLB prop bets, questions are bound to pop up. It's a good thing-it means you're moving past the surface-level stuff. Getting clear on the fundamentals, from key stats to bankroll strategy, is what separates a guessing game from a profitable approach.
Let's tackle some of the most common questions I hear from bettors trying to build a real edge.
What’s the Most Important Stat for Pitcher Strikeout Props?
A lot of people default to K/9 (strikeouts per nine innings), but the sharper metrics to focus on are K% (Strikeout Percentage) and CSW% (Called + Swinging Strike Rate). Why? Because K% measures strikeouts on a per-batter basis, which is a much cleaner number that isn't skewed by how many batters get on base.
Even better is CSW%. This stat gives you a raw look at a pitcher's ability to flat-out fool hitters, combining called strikes with whiffs. A pitcher with a high CSW% is constantly keeping batters off-balance, and that’s the core skill that leads to racking up punchouts.
How Much Does the Ballpark Really Affect Hitter Props?
It’s huge, and you should never ignore it. Park factors can easily be the deciding variable, especially for power-related props like total bases or home runs. A hitter-friendly launching pad like Great American Ball Park in Cincinnati can turn what would be a routine flyout elsewhere into a home run.
On the flip side, a cavernous park with dense, heavy air like Oracle Park in San Francisco can completely sap a hitter's power. That can make an "over" bet on their total bases a much tougher hill to climb. Always check park factor ratings before you lock in a hitter prop-they tell you exactly how a specific venue impacts offense compared to a neutral field.
The best bettors treat the ballpark like another player on the field. It’s not just a backdrop; it's an active variable that directly shapes the outcome. Ignoring it is like trying to analyze a matchup with one eye closed.
What Is Closing Line Value and Why Should I Care?
Closing Line Value (CLV) is the ultimate report card for your long-term betting success. It's simple: did you consistently get a better price than the final odds offered right before the game started? If you bet a pitcher over 5.5 strikeouts at -110 and the line closes at -140, you just got positive CLV.
This matters because the closing line is considered the market's most efficient and accurate price. By consistently beating it, you're proving that your analysis is ahead of the curve. While it won't guarantee a win on any single bet, a long-term track record of positive CLV is one of the strongest signs that you're a profitable bettor. It proves your process for finding value is sound.
Where Can I Find Good Data for MLB Prop Betting?
High-quality data is the engine behind any sharp betting model. The great news is that some of the best resources out there are completely free, and they're the same ones the pros use every day.
- FanGraphs: This is the gold standard for advanced baseball stats. It's your go-to for essential metrics like wOBA, ISO, and K% for both hitters and pitchers.
- Baseball Savant: Powered by MLB's own Statcast system, this site is a treasure trove of granular data. You can find everything from exit velocity and launch angle to detailed pitch-type splits for every player in the league.
- Umpire Scorecards: There's no single definitive source, but a quick search for "MLB umpire scorecards" on social media or sports analytics sites will show you which umps have a tighter or wider strike zone. This is a great little edge not many people look at.
Using these sites lets you move far beyond basic box score numbers and build a much stronger, data-driven case for your MLB prop bets.
Ready to put these data-driven strategies into practice and find your edge? ValueBetFactory uses advanced tools to scan the odds and alert you to profitable betting opportunities in real-time. Stop guessing and start making informed wagers by visiting us at ValueBetFactory to see how our platform can sharpen your betting game.