
Build a Spreadsheet for Sports Betting
Unlock Profits with betting tips!
If you're serious about making money from sports betting, you need to ditch the basic bet history in your apps and build your own spreadsheet. This is hands-down the most important tool you can have. It’s the difference between being a casual fan who makes a few guesses and someone who develops a real, data-driven strategy.

Why Bother With a Spreadsheet When Apps Are So Easy?
Look, betting apps are fantastic for one thing: placing bets quickly. But when it comes to actually understanding your own performance, they’re incredibly limited. Building your own tracker is the single biggest step you can take to move from just gambling to actually analyzing your wagers.
Think of it this way: a personalized spreadsheet lets you shine a spotlight on exactly where you’re winning and, more importantly, where you're bleeding cash. For instance, you might feel like you're good at picking NBA games, but your tracker could reveal a harsh truth: you’re killing it on NFL underdogs but consistently losing your shirt on basketball parlays. That’s a level of detail you’ll never get from a generic app.
Find Your Edge by Finding Yourself
Every single bettor has a unique fingerprint-a specific style and set of biases. A spreadsheet is how you discover yours. By logging every single wager, you’re not just keeping a record; you’re building a powerful dataset that tells the story of your betting habits.
This data helps you answer the questions that truly matter for your bottom line:
- What are my money-making sports? Is my deep knowledge of Premier League soccer actually paying off, or am I doing better with my gut feelings on college football?
- Which bet types do I crush? Maybe you’re a genius at picking over/under totals but can't seem to nail a moneyline bet to save your life.
- Am I getting the best odds? Tracking your wagers across different sportsbooks might show that you’re consistently finding better value at one over another.
This kind of self-scouting is crucial, especially now. The global sports betting market was valued at around $102.4 billion in 2024 and is forecast to explode to $265.5 billion by 2034. As more people jump in, finding a personal, sustainable edge is the only way to stay ahead of the curve. You can dig into the numbers in this global sports betting market report.
Moving from Hunches to Hard Data
At the end of the day, a betting spreadsheet is your personal command center. It’s a tool for accountability and discovery that turns vague "feelings" about how you're doing into cold, hard facts. This is what separates the pros from the crowd.
When you track every detail, you have no choice but to face reality. You can't ignore those costly habits or overlook the profitable niches you've stumbled into. Your spreadsheet becomes an honest mirror, reflecting your true skill and giving you the roadmap for real improvement and smart bankroll management.
Setting Up Your Core Bet Tracking Sheet
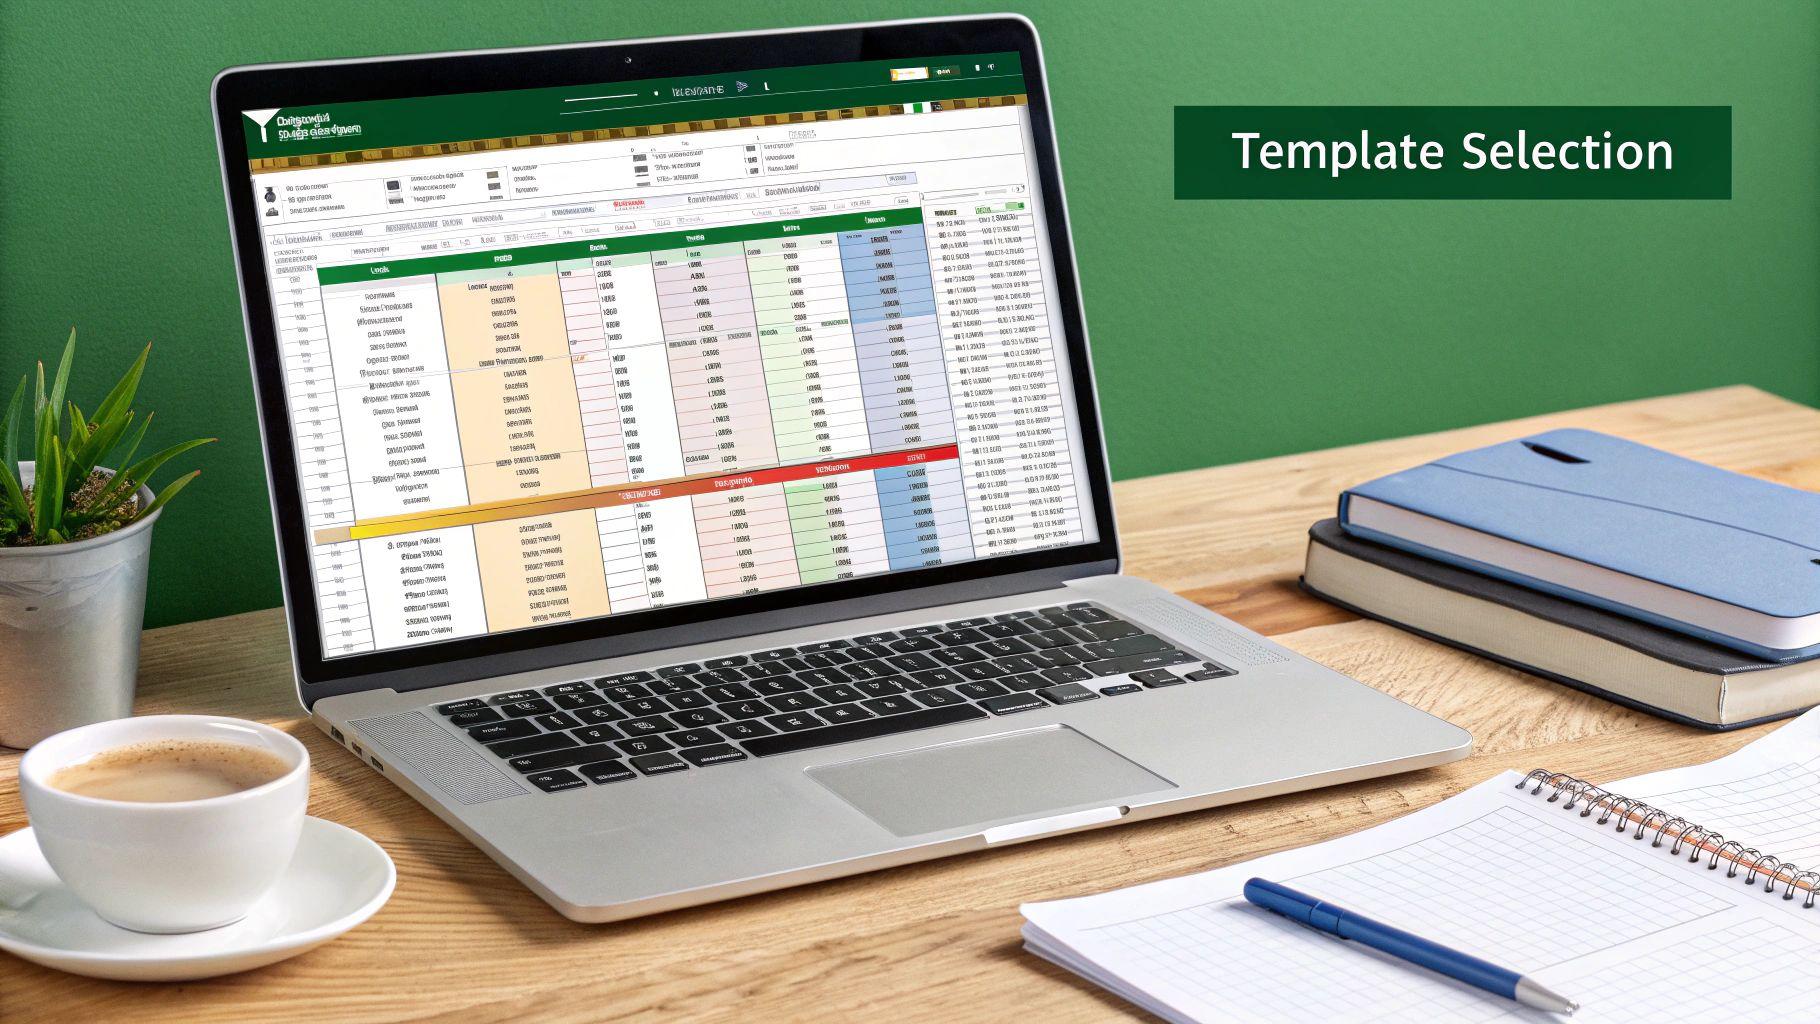
Alright, this is where we roll up our sleeves and build the foundation. Don't sweat it, though; this is simpler than it sounds. The heart of any truly useful sports betting spreadsheet is a clean, comprehensive log of every single bet you place. Think of this sheet as the engine of your entire operation-if you get this part right, everything else you build on top of it will be far more powerful.
Our goal here is to create a simple, logical system to capture the key details of each wager. The secret is consistency. When your tracker is well-organized, filling it out becomes a quick, two-minute habit instead of a chore. That discipline is what ensures your data is always accurate and ready for analysis.
The Must-Have Columns
To build a log that actually tells you something useful, we need to go beyond just the basics. Every column we add serves a specific purpose, helping paint the full picture of your betting performance. Let's start by opening a new sheet or tab and plugging these headers into the first row.
I've found that the best way to organize your bet log is to start with the descriptive details of the wager itself before getting into the financials.
Table: Essential Columns for Your Sports Betting Spreadsheet
Here's a breakdown of the key data points I recommend for every bet log. This setup provides the raw data needed for effective tracking and, later, deep-dive analysis.
| Column Header | Data Type | Purpose & Example |
|---|---|---|
| Date | Date | Crucial for tracking performance over time. Example: 10/25/2023 |
| Sport | Text | Helps you see which sports you're best (or worst) at. Example: NFL |
| Teams/Event | Text | Provides specific context for each bet. Example: Kansas City Chiefs vs. Baltimore Ravens |
| Bet Type | Text/Dropdown | Essential for analyzing what kinds of bets are most profitable for you. Example: Spread, Moneyline, Total |
| Sportsbook | Text | Lets you track which book offers the best lines and where your money is. Example: DraftKings, FanDuel |
| Stake | Currency | The amount of money you risked on the wager. Example: $50.00 |
| Odds | Number/Text | Record the odds in your preferred format. Example: -110 (American), 1.91 (Decimal) |
| Result | Dropdown | A simple "Win," "Loss," or "Push" makes formulas much easier. Example: Win |
| Profit/Loss | Currency (Formula) | Automatically calculates your return based on the other columns. Example: +$45.45 |
These columns give you a complete, at-a-glance snapshot of every wager you've placed, from the context to the cold, hard numbers.
The secret to a successful spreadsheet for sports betting isn't complexity; it's clarity. Your core sheet should be so easy to fill out that you can do it in 30 seconds after placing a bet, making disciplined tracking effortless.
Capturing The Financial Details
With the descriptive columns in place, we now add the numbers that will drive all your future analysis. These next few columns are the heart of your financial tracking, turning a simple log into a powerful bankroll management tool.
Here's what you'll add right next to the columns we just discussed:
- Stake: The exact amount you wagered.
- Odds: Record them in whatever format you prefer (I use American, but Decimal or Fractional work too).
- Result: I strongly recommend a simple dropdown menu here for Win, Loss, or Push. It keeps things clean.
- Profit/Loss: This is where the magic happens. We'll eventually drop a formula in here that automatically calculates your return based on the Stake, Odds, and Result.
This simple structure gives you a complete picture of every single wager. It's a tried-and-true method used by bettors everywhere. In fact, disciplined data tracking is essential in markets like the Asia-Pacific region, which accounts for a staggering 47% of all sports wagers globally, just to manage the sheer volume.
Once you have this core sheet set up, you've got a rock-solid foundation. If you want to see more examples or download a pre-built template to get started, you can find more in our detailed guide on the essential elements of a sports bet tracker spreadsheet.
Bringing Your Spreadsheet to Life with Formulas
Now for the fun part. A static list of your bets is okay, but we're here to build a powerful analytical tool, not just a digital notebook. By plugging in a few key formulas, you can make your spreadsheet do the heavy lifting for you. This means no more manual calculations, fewer mistakes, and instant feedback on how you're really doing.
This is the point where your spreadsheet stops being a chore and starts working for you, turning all that raw data into insights you can actually use.
Getting your data organized is the first step. This little workflow shows how simple it is to go from just collecting info to having it ready for real analysis.
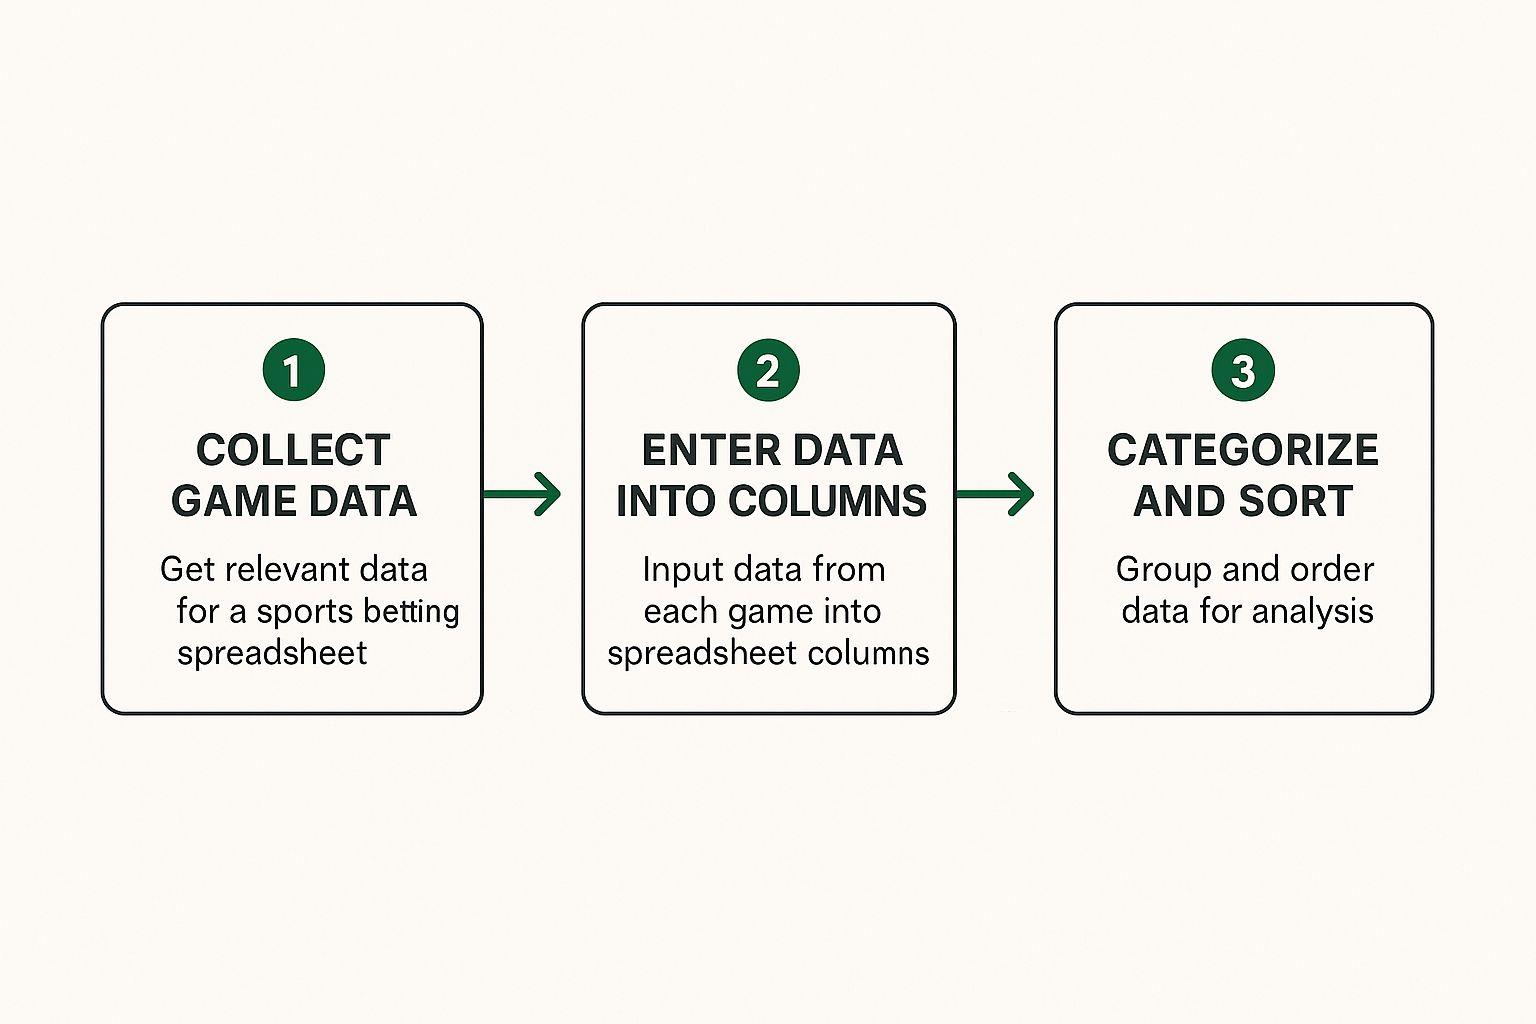
As you can see, a bit of discipline when you're entering your bets makes all the automation and analysis down the road a breeze.
Automatically Calculating Your Profit and Loss
Let’s start with the most critical formula of all: the one that figures out your profit or loss on each bet. Tallying this up by hand is a massive time-sink and an open invitation for errors. Instead, we'll use a nested IF statement that’s smart enough to know what to do with a win, a loss, or even a push.
Let’s assume your sheet is set up like this:
- Stake is in column F (cell F2)
- Odds are in column G (cell G2)
- Result is in column H (cell H2)
Pop this formula into your "Profit/Loss" column (I2):
=IF(H2="Win",IF(G2>0,(F2*G2)/100,F2/(G2/-100)),IF(H2="Loss",-F2,0))
I know it looks a bit complex, but it's doing three simple things for you:
- If the Result is "Win", it calculates the correct payout whether you bet on an underdog (positive American odds) or a favorite (negative American odds).
- If the Result is "Loss", it simply shows your stake as a negative number.
- If the Result is anything else (like "Push"), it just returns a 0.
Once you've entered that, just grab the little square at the bottom-right of the cell and drag it all the way down the column. Now, your profit calculates instantly every single time you log a result.
Tracking the Metrics That Matter
Beyond individual P/L, you need a high-level view of your performance. These next two formulas are perfect for a summary section or dashboard at the top of your sheet.
Figuring Out Your Win Rate
Your win rate is a great motivational stat. It tells you what percentage of your bets (excluding pushes) have been winners. To get this number, you just need to count your wins and divide by your total number of graded bets (wins + losses).
Here's the formula:
=COUNTIF(H:H, "Win") / (COUNTIF(H:H, "Win") + COUNTIF(H:H, "Loss"))
This scans your entire "Result" column (H:H) and gives you a live, up-to-the-minute win percentage.
Expert Tip: Don't get obsessed with win rate alone. I've seen plenty of bettors go broke with a 60% win rate because they were only betting on heavy favorites. True success comes from finding value, which is why profit and ROI are far more important long-term metrics.
Calculating Implied Probability
This one is huge for spotting value. Implied probability is just a way of converting the odds into the percentage chance the sportsbook thinks an outcome has of happening.
- For negative odds (e.g., -150):
=G2 / (G2 - 100) - For positive odds (e.g., +130):
=100 / (G2 + 100)
You can even combine these into a single IF formula for a dedicated "Implied Probability" column. This becomes incredibly powerful when you start filtering your data. Are you consistently beating the bookie's probability on NFL totals? This is how you find out.
This concept of finding an edge over the implied probability is the core of smart wagering, something we dive deep into in our guide on over under football betting strategies.
Finding Your Edge with Advanced Analysis
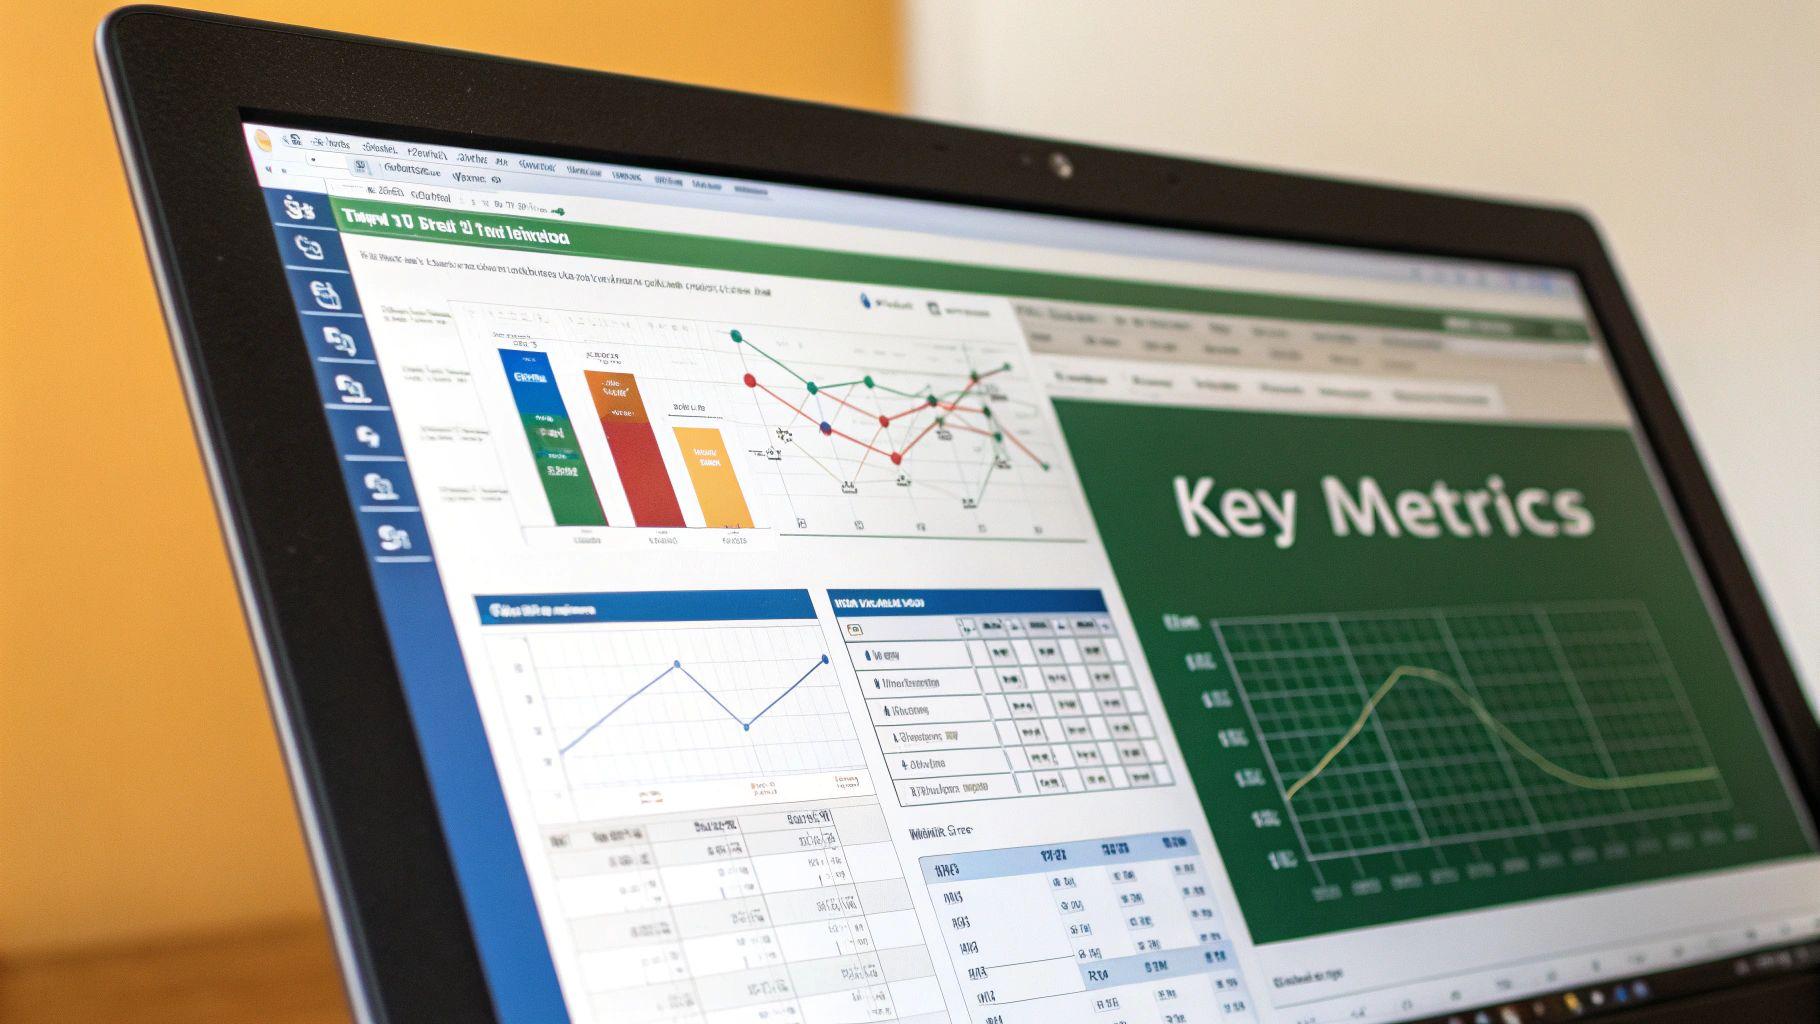
Okay, now for the fun part. With your data flowing and the formulas doing their thing, your spreadsheet is no longer just a simple log. It's a powerful dataset just waiting to tell you the secrets of your own betting habits. This is where we stop being bookkeepers and start acting like analysts, turning all those rows of data into real, actionable intelligence. This is how you find your edge.
The goal here is to get past the emotional high or low of a single win or loss and see the bigger picture. Are you consistently crushing it on NFL Sundays but bleeding money on Tuesday night MAC basketball? A well-built dashboard will tell you in an instant. This is how you find your profitable niches and, just as importantly, plug the leaks that are sinking your bankroll.
The reality is, sports betting has exploded online. As of 2024, a massive 78.2% of the market's revenue comes from online platforms, mostly because it's so easy to bet from your phone. This digital shift means we have more data at our fingertips than ever before, making a sharp, well-analyzed spreadsheet an indispensable tool. You can read more about how technology is shaping the global sports betting market to see just how big this has become.
Creating Your Performance Dashboard
Your first real step into proper analysis is to create a summary dashboard. I like to do this on a separate sheet or tab to keep things clean. This dashboard will pull all the key information from your main bet log and give you a high-level, at-a-glance view of your entire operation.
The absolute best tool for this job, bar none, is the PivotTable.
If you've never used a PivotTable, it's about to become your best friend. It lets you slice and dice your data with incredible flexibility without having to write a single complex formula. You can instantly group your bets by any category you've been tracking-sport, bet type, sportsbook, you name it. For example, in about three clicks, you can build a table that shows your total profit and loss for every single bet type you've ever made.
A dashboard transforms raw data into a narrative. It tells you the story of your betting performance, highlighting the successful chapters and pinpointing the plot twists where you went wrong. This story is your guide to making smarter decisions.
This is how you get undeniable proof of what's working and what isn't. You might discover you have a fantastic return on moneyline underdogs but are getting killed on point spreads. That's not just an interesting tidbit; that's a direct instruction on where you should be focusing your money.
Visualizing Trends with Charts
Numbers in a table are great, but our brains are wired to process visual information much faster. This is where charts come into play. By turning those pivot table summaries into a few simple graphs, you can spot trends and patterns in seconds that you might completely miss otherwise.
A few charts I consider essential:
- Running Profit/Loss Graph: A simple line chart tracking your cumulative profit over time. It's the ultimate big-picture visual. You can instantly see the real impact of your winning and losing streaks on your bankroll.
- Profit by Sport Bar Chart: This one is a no-brainer. It quickly shows which sports are your cash cows and which ones are just draining your funds.
- Profit by Bet Type Pie Chart: Want to see what percentage of your profits (or losses) are coming from moneylines versus spreads, totals, or those tempting parlays? This is the chart for that.
These visuals aren't just for making your spreadsheet look fancy. They provide immediate, powerful feedback. A downward-trending profit line is a clear signal that you need to stop and reassess what you're doing. A bar chart showing heavy losses in a specific area tells you exactly where to start digging for problems.
Focusing on Key Performance Indicators
To truly understand your betting performance, you have to look beyond a simple win-loss record. I’ve seen people with 60% win rates go broke. You need to track the metrics that tell you how efficient and genuinely profitable your betting is. These are your Key Performance Indicators, or KPIs.
Here's a quick rundown of the most important metrics I track to really understand betting performance.
| Metric | What It Measures | Why It's Important |
|---|---|---|
| Return on Investment (ROI) | Your total profit divided by your total amount staked. | The single most important metric. It shows how efficiently you are using your capital, regardless of your win rate. A positive ROI is the ultimate goal. |
| Average Stake | The average amount of money you wager per bet. | Helps you understand your risk tolerance and whether "stake creep" (unintentionally increasing your bet size) is becoming an issue. |
| Closing Line Value (CLV) | The difference between the odds you bet and the final closing odds. | A more advanced metric that shows if you're consistently getting better numbers than the market average. Beating the closing line is a strong indicator of long-term skill. |
Tracking these KPIs is what separates casual bettors from those who treat it like a serious investment. They provide the context needed to make informed, strategic decisions rather than just chasing wins.
Maintaining and Upgrading Your Betting Spreadsheet
So you've built your spreadsheet. That's a massive first step, but the real magic happens when you use it consistently over the long haul. A forgotten tracker is just a digital graveyard of old bets. A well-maintained one, however, evolves with you and becomes the single most powerful tool for sharpening your strategy.
The absolute cornerstone of making this work is consistent data entry. I can't stress this enough.
Get into the habit of logging every single bet right after you place it. Then, update the result as soon as the event is over. This simple discipline keeps you from ever having a backlog and ensures your analysis is always based on a complete, accurate picture of your performance. If you let it slide for even a few days, catching up becomes a chore, and that's when most people give up.
Taking Your Spreadsheet to the Next Level
Once you’ve got the basics down and have a couple of hundred bets under your belt, it’s time to think about adding some more advanced features. Think of your first spreadsheet as version 1.0. Now we can start building out version 2.0 to unlock some seriously deep insights into your betting habits.
You don't need these from the get-go, but they are fantastic for finding subtle edges you might be missing.
Here are a couple of powerful additions I’d recommend:
- Closing Line Value (CLV): This is a big one. By tracking the difference between the odds you locked in and the final odds right before the game started, you get a pure metric of your skill. If you consistently beat the closing line, it’s a strong signal that you’re finding value before the rest of the market catches on.
- Performance by Odds Range: Are you better at picking favorites or underdogs? You can find out by creating a new column that categorizes your bets into buckets like "Heavy Favorite" (e.g., -200 or lower), "Favorite" (-199 to -110), and "Underdog" (+100 or higher). Analyzing your profit and loss in each category might show you’re crushing it with slight underdogs but bleeding money on heavy favorites.
Your spreadsheet should be a living document that grows with your experience. Start simple to build the habit, then layer in more complexity as you get comfortable. The end goal is a custom tool that perfectly reflects and informs your unique betting style.
Expanding Your Bankroll Management
As your betting volume grows, you'll probably want a more sophisticated way to manage your bankroll. The running total on your main sheet is a great start, but creating a dedicated tab for your finances can give you a much clearer overview.
On a separate sheet, you could track every deposit and withdrawal you make across all your sportsbooks. You could also set it up to monitor your total exposure on any given day or to enforce strict stop-loss limits.
This approach keeps your primary bet log clean and focused on performance, while the new tab gives you that crucial high-level financial dashboard. To really understand why this separation is so vital, check out our guide on why a dedicated sports betting tracker is a non-negotiable for anyone serious about making a profit. It always comes back to the same principle: turning raw data into smarter wagers.
Still Have Questions? Let's Talk Spreadsheets

Once you start using a spreadsheet to track your bets, you're bound to run into a few questions. It happens to everyone. Let's walk through some of the most common things people ask so you can keep your sheet running smoothly and avoid any frustrating hiccups.
A big one right off the bat is software. Do you have to use Microsoft Excel? Not at all. Google Sheets is a fantastic alternative, and everything we've covered works just as well there. The best part about Sheets is that it lives in the cloud, meaning you can pull it up on your phone to log a bet right after you place it, no matter where you are.
Getting the Most Out of Your Tracker
So, how often should you actually update this thing? The key is discipline. I can't stress this enough. Get into the habit of entering a wager the second you place it and updating the result as soon as the game ends. If you let it slide, you'll end up with a backlog of bets to enter, and that’s when mistakes happen. This simple routine keeps your data pristine and gives you an honest, up-to-the-minute look at your performance.
What's the one metric you absolutely have to watch? Forget win rate. It's all about Return on Investment (ROI). ROI tells you how much profit you’re making for every dollar you risk. You could have a sky-high win rate by only betting on massive favorites, but you'd still be losing money. A savvy bettor might have a lower win rate but is wildly profitable because they find value in underdogs. ROI is the true north of betting success.
When you start analyzing your performance, it's tempting to focus on your win-loss record. But as I said, your ROI is what truly measures how good you are at this. It’s the ultimate metric for separating bettors who just pick winners from those who consistently find value.
What to Do When Things Go Wrong
It's inevitable: eventually, a formula is going to break. Don't panic. Nine times out of ten, it’s a simple typo or a bad cell reference. Before you do anything else, carefully check that your formula is pointing to the right cells for your stake, odds, and result.
Also, make sure your data formats are consistent. Are your odds entered as numbers? Is your "Win/Loss" column using the exact text your formulas expect? When you drag a formula down a column, it's also a good idea to click on a few of the new cells to make sure the references adjusted correctly. A tiny error can snowball, so a quick double-check is always time well spent.
At ValueBetFactory, we live and breathe this stuff. We're all about making data-driven decisions to become smarter, more profitable bettors. Our platform gives you the insights and resources to find your edge and manage your bankroll like a pro. See how we can help you turn your betting data into profit over at